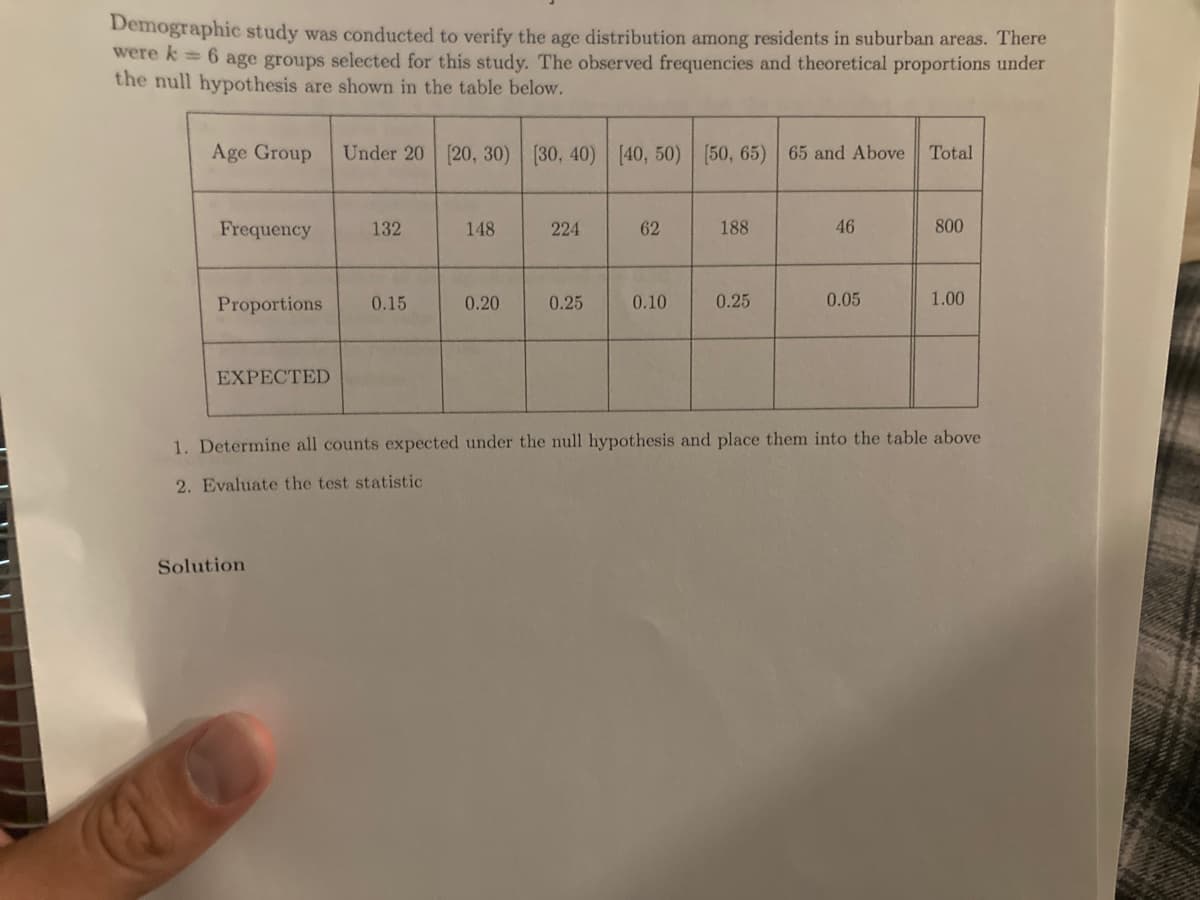
Demographic study was conducted to verify the age distribution among residents in suburban areas. There were k= 6 age groups selected for this study. The observed frequencies and theoretical proportions under the null hypothesis are shown in the table below. Age Group Under 20 [20, 30) [30, 40) [40, 50) [50, 65) 65 and Above Total Frequency 132 148 224 62 188 46 800
Demographic study was conducted to verify the age distribution among residents in suburban areas. There were k= 6 age groups selected for this study. The observed frequencies and theoretical proportions under the null hypothesis are shown in the table below. Age Group Under 20 [20, 30) [30, 40) [40, 50) [50, 65) 65 and Above Total Frequency 132 148 224 62 188 46 800

Holt Mcdougal Larson Pre-algebra: Student Edition 2012
1st Edition
ISBN:9780547587776
Author:HOLT MCDOUGAL
Publisher:HOLT MCDOUGAL
Chapter11: Data Analysis And Probability
Section: Chapter Questions
Problem 8CR

Related questions
Question
Transcribed Image Text:Demographic study was conducted to verify the age distribution among residents in suburban areas. There
were k 6 age groups selected for this study. The observed frequencies and theoretical proportions under
the null hypothesis are shown in the table below.
Age Group
Under 20 [20, 30) [30, 40) [40, 50) [50, 65) 65 and Above Total
Frequency
132
148
224
62
188
46
800
Proportions
0.15
0.20
0.25
0.10
0.25
0.05
1.00
EXPECTED
1. Determine all counts expected under the null hypothesis and place them into the table above
2. Evaluate the test statistic
Solution
Expert Solution
This question has been solved!
Explore an expertly crafted, step-by-step solution for a thorough understanding of key concepts.

This is a popular solution!

Trending now
This is a popular solution!

Step by step
Solved in 2 steps

Recommended textbooks for you
Holt Mcdougal Larson Pre-algebra: Student Edition…
Algebra
ISBN:
9780547587776
Author:
HOLT MCDOUGAL
Publisher:
HOLT MCDOUGAL
Holt Mcdougal Larson Pre-algebra: Student Edition…
Algebra
ISBN:
9780547587776
Author:
HOLT MCDOUGAL
Publisher:
HOLT MCDOUGAL