Descriptive Statistics Minimum Maximum Sum Range Мean Std. Deviation Variance Sales 15 20 197 24.80 3.53 12.46 a) Calculate the missing values in the table (Sum and Range) b) | The average sales was $26.6 last year and the manager of the firm claim that there is a decrease in the sales this year. Does the data provide sufficient evidence to support the claim of the manager at 1% significance level? Show your calculations in detail and interpret the result.
Descriptive Statistics Minimum Maximum Sum Range Мean Std. Deviation Variance Sales 15 20 197 24.80 3.53 12.46 a) Calculate the missing values in the table (Sum and Range) b) | The average sales was $26.6 last year and the manager of the firm claim that there is a decrease in the sales this year. Does the data provide sufficient evidence to support the claim of the manager at 1% significance level? Show your calculations in detail and interpret the result.

MATLAB: An Introduction with Applications
6th Edition
ISBN:9781119256830
Author:Amos Gilat
Publisher:Amos Gilat
Chapter1: Starting With Matlab
Section: Chapter Questions
Problem 1P

Related questions
Topic Video
Question
can u solve it please this is very important
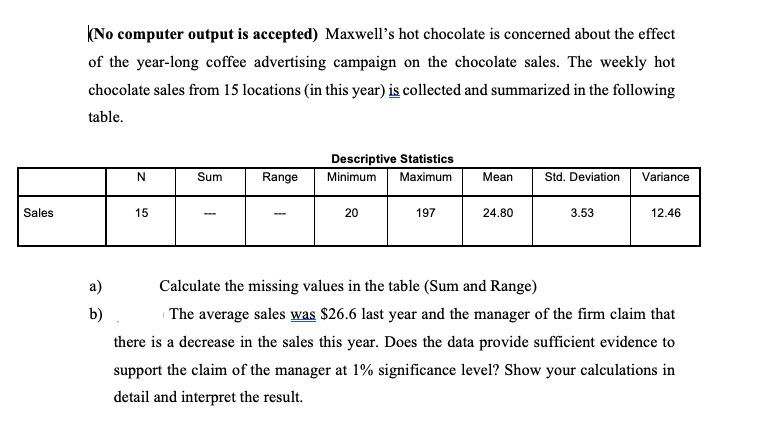
Transcribed Image Text:(No computer output is accepted) Maxwell's hot chocolate is concerned about the effect
of the year-long coffee advertising campaign on the chocolate sales. The weekly hot
chocolate sales from 15 locations (in this year) is collected and summarized in the following
table.
Descriptive Statistics
Maximum
N.
Sum
Range
Minimum
Mean
Std. Deviation
Variance
Sales
15
20
197
24.80
3.53
12.46
a)
Calculate the missing values in the table (Sum and Range)
b)
The average sales was $26.6 last year and the manager of the firm claim that
there is a decrease in the sales this year. Does the data provide sufficient evidence to
support the claim of the manager at 1% significance level? Show your calculations in
detail and interpret the result.
Expert Solution
This question has been solved!
Explore an expertly crafted, step-by-step solution for a thorough understanding of key concepts.

This is a popular solution!

Trending now
This is a popular solution!

Step by step
Solved in 2 steps

Knowledge Booster


Learn more about
Need a deep-dive on the concept behind this application? Look no further. Learn more about this topic, statistics and related others by exploring similar questions and additional content below.Recommended textbooks for you
MATLAB: An Introduction with Applications
Statistics
ISBN:
9781119256830
Author:
Amos Gilat
Publisher:
John Wiley & Sons Inc

Probability and Statistics for Engineering and th…
Statistics
ISBN:
9781305251809
Author:
Jay L. Devore
Publisher:
Cengage Learning

Statistics for The Behavioral Sciences (MindTap C…
Statistics
ISBN:
9781305504912
Author:
Frederick J Gravetter, Larry B. Wallnau
Publisher:
Cengage Learning
MATLAB: An Introduction with Applications
Statistics
ISBN:
9781119256830
Author:
Amos Gilat
Publisher:
John Wiley & Sons Inc
Probability and Statistics for Engineering and th…
Statistics
ISBN:
9781305251809
Author:
Jay L. Devore
Publisher:
Cengage Learning
Statistics for The Behavioral Sciences (MindTap C…
Statistics
ISBN:
9781305504912
Author:
Frederick J Gravetter, Larry B. Wallnau
Publisher:
Cengage Learning

Elementary Statistics: Picturing the World (7th E…
Statistics
ISBN:
9780134683416
Author:
Ron Larson, Betsy Farber
Publisher:
PEARSON

The Basic Practice of Statistics
Statistics
ISBN:
9781319042578
Author:
David S. Moore, William I. Notz, Michael A. Fligner
Publisher:
W. H. Freeman

Introduction to the Practice of Statistics
Statistics
ISBN:
9781319013387
Author:
David S. Moore, George P. McCabe, Bruce A. Craig
Publisher:
W. H. Freeman