Part A All the output is generated based on the data set 'PSYC A331F Statistical Report File 1 answer the following questions 1. There are eight questions related to sense of community (ranged from 1-5, 1 low sense of belonging, 5 high sense of belonging) and five questions related to life satisfaction (ranged from 1-6, 1 = very dissatisfied, 6 = very satisfied) The average score of sense of community named as 'average sense of community (ASOC) and an average score of life satisfaction named as 'average life satisfaction (ALS) were computed and shown as below, write a short paragraph to report the descriptive statistics of both variables (ASOC & ALS) according to the age group (Variable: AgeGroup: 1 Young-old, 2 = Old-old) Descriptives AgeGroup Youngold Descriptve Statistics N Range s atist Statst ast Stac 8tasstc Nnmum Naumum Wean Std. Deviaton Varance Skewness Kurtasis Sta9 stc Statiss S. Emer Stat stic33. Emor Stat stic8d Emar 8tastc 8tastc 8tasto Statis 8ta1stcl ASOC ALS vaidNgstws 371 300 200 500 38191 45302 205 405 127 188 253 4629 371 560 140 7.00 1935 845 205 127 749 253 371 AgeGroup Youngold AgeGroup Oldold Descripve Satistics Mean S. Deviaton Varance Skewness N Range Nnmum Maimum Kartasis Staistc Statiss St. Eer Statstic S1d.Emor Stat gtc3 Emar Stast Stastic Staristn Stat sik 8tansto Statis ASOC ALS vaidNdistwisa 282 2.13 28B 5.00 3.9007 36501 133 173 145 1.105 28 282 520 180 7.00 48163 s0480 819 115 145 810 289 282 aAgeCroup Cidd 2. According to the output shown as follows, does health status (Variable: Health, = bad health, 5 excellent health) differ significantly across age ranged from 1-5, group? T-Test Gp Staics Sd Fn ManS Deon Sd Devaton дик Youngo N Msan Serated heal 04615 242 Old 22 23227 05192 pended Saps fest Livin's Teslfar Eqaay stfa EsorMa arnc 9%Candenrein efhe Dece Upper Man Once StdEnor Dence Lower 1 Sig aed F Sig Selrated health 1200 23 153 125 1088 Deses 2427 assunad Equl vaass net 10 524 187 128 DES4M 2423 nsumed 3. The partial correlation test among Health, ASOC and ALS while controlling gender and age is done and the output is shown as follows. Report the most significant correlation pair and comment on the strength of the relationship. Partial Corr Correlations Ser-ralad Control Variables hone haath ASOC ALS Age 0andar Self-rated heath Corelation 1000 137 334 048 -071 Signincance (2-taled D00 .000 218 069 d 651 651 651 651 ASOC Comralation 137 1.000 460 166 027 Signncance (2-taled 000 000 000 487 651 0 651 651 651 013 ALS Correlation 334 460 1.000 150 Signncance (2-aled) 000 D00 732 651 651 0 651 651 Correlation Age 048 166 150 1.000 069 Signincance (2taled 218 000 000 079 d 651 651 651 0 651 Gandar Comalation -071 .027 069 .013 1000 Signncance (2-taled 069 487 732 079 651 651 651 651 0 Self-rated heath Corelation Age & Genden 1000 151 347 Signncance (2-taled 000 000 d 649 649 ASOC Comaiation 151 1.000 447 Signcance (2-taled) 000 000 649 649 ALS Correlation 347 447 1.000 Signcance (2-taledy 000 000 d 649 649 0 a. Cells contain zero-order (Pears on) corelations. 4. A multiple regression analysis is run to determine whether ALS (criterion variable) can be predicted by (i) Age, (ii) Gender, (iii) Health and (iv) ASOC (predictor variables). The statistical output is shown as follows. Write a short paragraph to comment on the ANOVA table, then report the standard deviation changed in criterion variable by one mark increases in every statistically significant explanatory variable Regression Descriptive Statistics Mean Std Devtation N- ALS Age Gender 47100 91711 653 8.38303 72.7274 653 1,7764 41697 653 Self-rated health 653 2.3828 16B8 ASOC 38543 41895 653 Correlations Sef-rated ASOC ALS Age Gender health Pearson Correlation ALS 1000 150 -013 334 460 Аge 150 1.000 069 .048 166 Gender 013 069 1000 071 027 Self-ratad health 071 137 334 048 1.000 ASOC 460 166 027 137 1,000 Sig. (1-tailed ALS 000 366 000 000 Age 000 039 109 000 Gender 366 039 034 243 Self-ratad health 000 109 034 000 ASOC 000 000 243 000 N ALS 653 653 653 653 653 Age 653 653 653 653 653 Gender 653 653 653 653 653 Self-rated health 653 653 653 653 653 ASOC 653 653 653 653 653 Variables Entered Removed Variables Variables Entered Method Removed Model ASOC, 1 Gender, Self Enter rated health, Age a. Dependent Variable: ALS b. All requested variables entered Model Summary Std. Error of the Estimate Adjusted R Square R R Square Model 544 296 291 77205 a. Predictors: (Constant), ASOC, Gender, Self-rated health, Age ANOVA Sum of Mean Square Model Squares df Sig Regression 4 162.136 68.003 000 1 40.534 Residual 386.250 648 596 Total 548.385 652 a. Dependent Variable: ALS b. Predictors: (Constant), ASOC, Gender, Selfrated health, Age Coefficients Standardized Coefficients Unstandardized Coefficients 95.0% Cenfidence Interval for B В Std. Error Beta Lower Bound Upper Bound Sia Madel 1 (Constant 187 388 483 629 949 575 Age 011 004 096 2.868 004 018 003 Gender 005 073 002 071 943 138 149 Self-rated health 000 295 035 284 8.471 226 363 ASOC 000 887 074 405 11.972 741 1.032 a Dependent Variable: ALS
Part A All the output is generated based on the data set 'PSYC A331F Statistical Report File 1 answer the following questions 1. There are eight questions related to sense of community (ranged from 1-5, 1 low sense of belonging, 5 high sense of belonging) and five questions related to life satisfaction (ranged from 1-6, 1 = very dissatisfied, 6 = very satisfied) The average score of sense of community named as 'average sense of community (ASOC) and an average score of life satisfaction named as 'average life satisfaction (ALS) were computed and shown as below, write a short paragraph to report the descriptive statistics of both variables (ASOC & ALS) according to the age group (Variable: AgeGroup: 1 Young-old, 2 = Old-old) Descriptives AgeGroup Youngold Descriptve Statistics N Range s atist Statst ast Stac 8tasstc Nnmum Naumum Wean Std. Deviaton Varance Skewness Kurtasis Sta9 stc Statiss S. Emer Stat stic33. Emor Stat stic8d Emar 8tastc 8tastc 8tasto Statis 8ta1stcl ASOC ALS vaidNgstws 371 300 200 500 38191 45302 205 405 127 188 253 4629 371 560 140 7.00 1935 845 205 127 749 253 371 AgeGroup Youngold AgeGroup Oldold Descripve Satistics Mean S. Deviaton Varance Skewness N Range Nnmum Maimum Kartasis Staistc Statiss St. Eer Statstic S1d.Emor Stat gtc3 Emar Stast Stastic Staristn Stat sik 8tansto Statis ASOC ALS vaidNdistwisa 282 2.13 28B 5.00 3.9007 36501 133 173 145 1.105 28 282 520 180 7.00 48163 s0480 819 115 145 810 289 282 aAgeCroup Cidd 2. According to the output shown as follows, does health status (Variable: Health, = bad health, 5 excellent health) differ significantly across age ranged from 1-5, group? T-Test Gp Staics Sd Fn ManS Deon Sd Devaton дик Youngo N Msan Serated heal 04615 242 Old 22 23227 05192 pended Saps fest Livin's Teslfar Eqaay stfa EsorMa arnc 9%Candenrein efhe Dece Upper Man Once StdEnor Dence Lower 1 Sig aed F Sig Selrated health 1200 23 153 125 1088 Deses 2427 assunad Equl vaass net 10 524 187 128 DES4M 2423 nsumed 3. The partial correlation test among Health, ASOC and ALS while controlling gender and age is done and the output is shown as follows. Report the most significant correlation pair and comment on the strength of the relationship. Partial Corr Correlations Ser-ralad Control Variables hone haath ASOC ALS Age 0andar Self-rated heath Corelation 1000 137 334 048 -071 Signincance (2-taled D00 .000 218 069 d 651 651 651 651 ASOC Comralation 137 1.000 460 166 027 Signncance (2-taled 000 000 000 487 651 0 651 651 651 013 ALS Correlation 334 460 1.000 150 Signncance (2-aled) 000 D00 732 651 651 0 651 651 Correlation Age 048 166 150 1.000 069 Signincance (2taled 218 000 000 079 d 651 651 651 0 651 Gandar Comalation -071 .027 069 .013 1000 Signncance (2-taled 069 487 732 079 651 651 651 651 0 Self-rated heath Corelation Age & Genden 1000 151 347 Signncance (2-taled 000 000 d 649 649 ASOC Comaiation 151 1.000 447 Signcance (2-taled) 000 000 649 649 ALS Correlation 347 447 1.000 Signcance (2-taledy 000 000 d 649 649 0 a. Cells contain zero-order (Pears on) corelations. 4. A multiple regression analysis is run to determine whether ALS (criterion variable) can be predicted by (i) Age, (ii) Gender, (iii) Health and (iv) ASOC (predictor variables). The statistical output is shown as follows. Write a short paragraph to comment on the ANOVA table, then report the standard deviation changed in criterion variable by one mark increases in every statistically significant explanatory variable Regression Descriptive Statistics Mean Std Devtation N- ALS Age Gender 47100 91711 653 8.38303 72.7274 653 1,7764 41697 653 Self-rated health 653 2.3828 16B8 ASOC 38543 41895 653 Correlations Sef-rated ASOC ALS Age Gender health Pearson Correlation ALS 1000 150 -013 334 460 Аge 150 1.000 069 .048 166 Gender 013 069 1000 071 027 Self-ratad health 071 137 334 048 1.000 ASOC 460 166 027 137 1,000 Sig. (1-tailed ALS 000 366 000 000 Age 000 039 109 000 Gender 366 039 034 243 Self-ratad health 000 109 034 000 ASOC 000 000 243 000 N ALS 653 653 653 653 653 Age 653 653 653 653 653 Gender 653 653 653 653 653 Self-rated health 653 653 653 653 653 ASOC 653 653 653 653 653 Variables Entered Removed Variables Variables Entered Method Removed Model ASOC, 1 Gender, Self Enter rated health, Age a. Dependent Variable: ALS b. All requested variables entered Model Summary Std. Error of the Estimate Adjusted R Square R R Square Model 544 296 291 77205 a. Predictors: (Constant), ASOC, Gender, Self-rated health, Age ANOVA Sum of Mean Square Model Squares df Sig Regression 4 162.136 68.003 000 1 40.534 Residual 386.250 648 596 Total 548.385 652 a. Dependent Variable: ALS b. Predictors: (Constant), ASOC, Gender, Selfrated health, Age Coefficients Standardized Coefficients Unstandardized Coefficients 95.0% Cenfidence Interval for B В Std. Error Beta Lower Bound Upper Bound Sia Madel 1 (Constant 187 388 483 629 949 575 Age 011 004 096 2.868 004 018 003 Gender 005 073 002 071 943 138 149 Self-rated health 000 295 035 284 8.471 226 363 ASOC 000 887 074 405 11.972 741 1.032 a Dependent Variable: ALS

Algebra & Trigonometry with Analytic Geometry
13th Edition
ISBN:9781133382119
Author:Swokowski
Publisher:Swokowski
Chapter5: Inverse, Exponential, And Logarithmic Functions
Section: Chapter Questions
Problem 12DE

Related questions
Question
Transcribed Image Text:Part A
All the output is generated based on the data set 'PSYC A331F Statistical Report File 1
answer the following questions
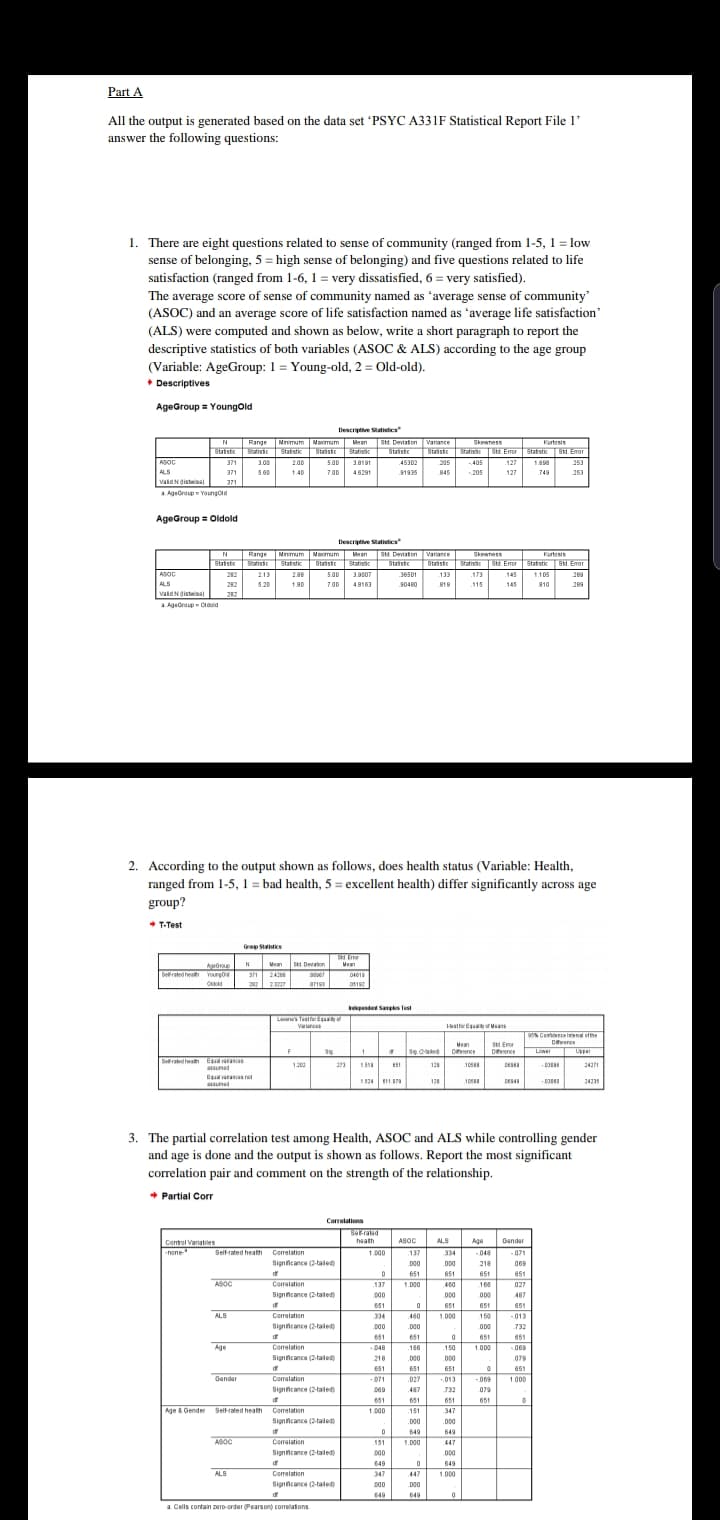
1. There are eight questions related to sense of community (ranged from 1-5, 1 low
sense of belonging, 5 high sense of belonging) and five questions related to life
satisfaction (ranged from 1-6, 1 = very dissatisfied, 6 = very satisfied)
The average score of sense of community named as 'average sense of community
(ASOC) and an average score of life satisfaction named as 'average life satisfaction
(ALS) were computed and shown as below, write a short paragraph to report the
descriptive statistics of both variables (ASOC & ALS) according to the age group
(Variable: AgeGroup: 1 Young-old, 2 = Old-old)
Descriptives
AgeGroup Youngold
Descriptve Statistics
N Range
s atist Statst ast Stac 8tasstc
Nnmum
Naumum
Wean Std. Deviaton Varance
Skewness
Kurtasis
Sta9 stc
Statiss
S. Emer Stat stic33. Emor
Stat stic8d Emar
8tastc
8tastc
8tasto
Statis
8ta1stcl
ASOC
ALS
vaidNgstws
371
300
200
500
38191
45302
205
405
127
188
253
4629
371
560
140
7.00
1935
845
205
127
749
253
371
AgeGroup Youngold
AgeGroup Oldold
Descripve Satistics
Mean S. Deviaton Varance Skewness
N Range Nnmum Maimum
Kartasis
Staistc Statiss St. Eer Statstic S1d.Emor
Stat gtc3 Emar
Stast
Stastic
Staristn
Stat sik
8tansto
Statis
ASOC
ALS
vaidNdistwisa
282 2.13
28B
5.00
3.9007
36501
133
173
145
1.105
28
282
520
180
7.00
48163
s0480
819
115
145
810
289
282
aAgeCroup Cidd
2. According to the output shown as follows, does health status (Variable: Health,
= bad health, 5 excellent health) differ significantly across age
ranged from 1-5,
group?
T-Test
Gp Staics
Sd Fn
ManS Deon
Sd Devaton
дик
Youngo
N
Msan
Serated heal
04615
242
Old
22
23227
05192
pended Saps fest
Livin's Teslfar Eqaay
stfa EsorMa
arnc
9%Candenrein efhe
Dece
Upper
Man
Once
StdEnor
Dence
Lower
1
Sig aed
F
Sig
Selrated health
1200
23
153
125
1088
Deses
2427
assunad
Equl vaass net
10
524
187
128
DES4M
2423
nsumed
3. The partial correlation test among Health, ASOC and ALS while controlling gender
and age is done and the output is shown as follows. Report the most significant
correlation pair and comment on the strength of the relationship.
Partial Corr
Correlations
Ser-ralad
Control Variables
hone
haath
ASOC
ALS
Age
0andar
Self-rated heath
Corelation
1000
137
334
048
-071
Signincance (2-taled
D00
.000
218
069
d
651
651
651
651
ASOC
Comralation
137
1.000
460
166
027
Signncance (2-taled
000
000
000
487
651
0
651
651
651
013
ALS
Correlation
334
460
1.000
150
Signncance (2-aled)
000
D00
732
651
651
0
651
651
Correlation
Age
048
166
150
1.000
069
Signincance (2taled
218
000
000
079
d
651
651
651
0
651
Gandar
Comalation
-071
.027
069
.013
1000
Signncance (2-taled
069
487
732
079
651
651
651
651
0
Self-rated heath Corelation
Age & Genden
1000
151
347
Signncance (2-taled
000
000
d
649
649
ASOC
Comaiation
151
1.000
447
Signcance (2-taled)
000
000
649
649
ALS
Correlation
347
447
1.000
Signcance (2-taledy
000
000
d
649
649
0
a. Cells contain zero-order (Pears on) corelations.
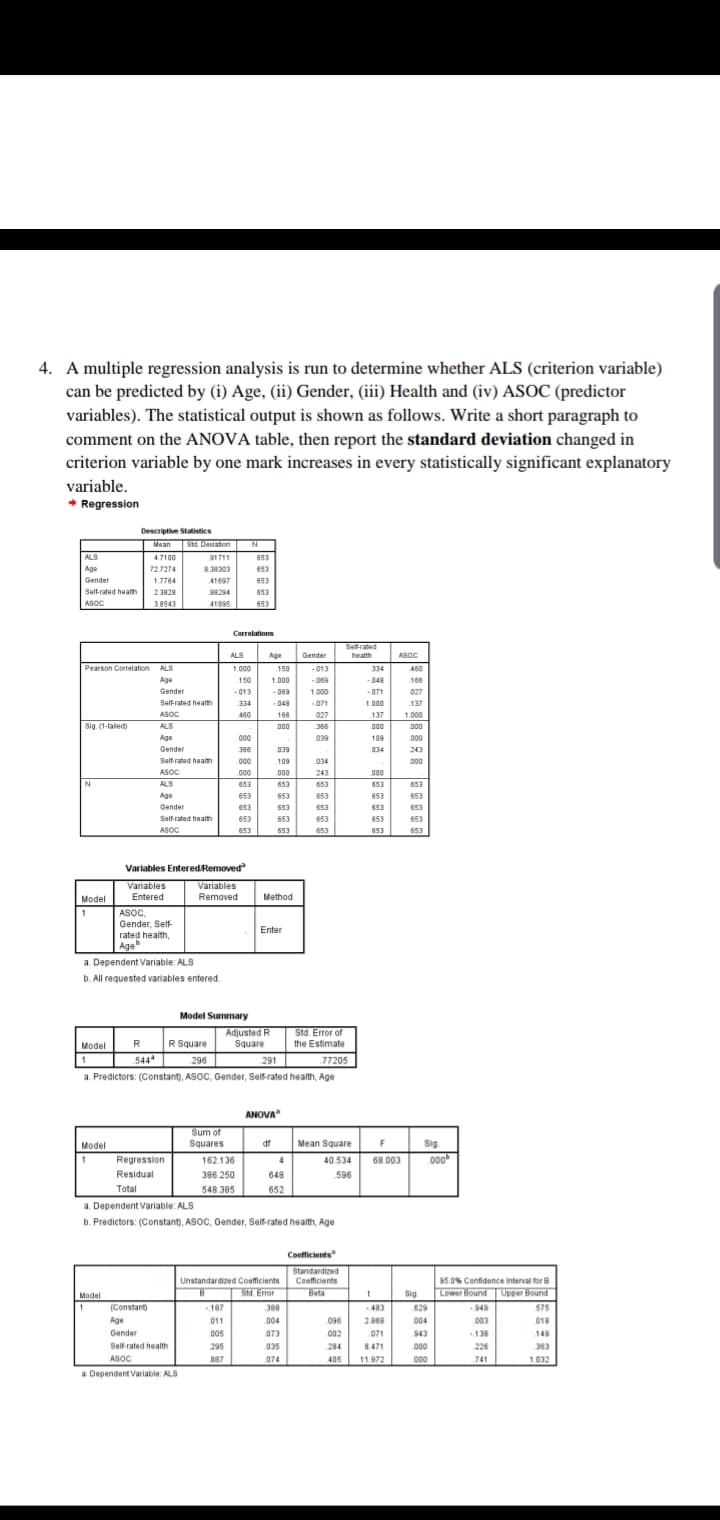
Transcribed Image Text:4. A multiple regression analysis is run to determine whether ALS (criterion variable)
can be predicted by (i) Age, (ii) Gender, (iii) Health and (iv) ASOC (predictor
variables). The statistical output is shown as follows. Write a short paragraph to
comment on the ANOVA table, then report the standard deviation changed in
criterion variable by one mark increases in every statistically significant explanatory
variable
Regression
Descriptive Statistics
Mean Std Devtation
N-
ALS
Age
Gender
47100
91711
653
8.38303
72.7274
653
1,7764
41697
653
Self-rated health
653
2.3828
16B8
ASOC
38543
41895
653
Correlations
Sef-rated
ASOC
ALS
Age
Gender
health
Pearson Correlation
ALS
1000
150
-013
334
460
Аge
150
1.000
069
.048
166
Gender
013
069
1000
071
027
Self-ratad health
071
137
334
048
1.000
ASOC
460
166
027
137
1,000
Sig. (1-tailed
ALS
000
366
000
000
Age
000
039
109
000
Gender
366
039
034
243
Self-ratad health
000
109
034
000
ASOC
000
000
243
000
N
ALS
653
653
653
653
653
Age
653
653
653
653
653
Gender
653
653
653
653
653
Self-rated health
653
653
653
653
653
ASOC
653
653
653
653
653
Variables Entered Removed
Variables
Variables
Entered
Method
Removed
Model
ASOC,
1
Gender, Self
Enter
rated health,
Age
a. Dependent Variable: ALS
b. All requested variables entered
Model Summary
Std. Error of
the Estimate
Adjusted R
Square
R
R Square
Model
544
296
291
77205
a. Predictors: (Constant), ASOC, Gender, Self-rated health, Age
ANOVA
Sum of
Mean Square
Model
Squares
df
Sig
Regression
4
162.136
68.003
000
1
40.534
Residual
386.250
648
596
Total
548.385
652
a. Dependent Variable: ALS
b. Predictors: (Constant), ASOC, Gender, Selfrated health, Age
Coefficients
Standardized
Coefficients
Unstandardized Coefficients
95.0% Cenfidence Interval for B
В
Std. Error
Beta
Lower Bound
Upper Bound
Sia
Madel
1
(Constant
187
388
483
629
949
575
Age
011
004
096
2.868
004
018
003
Gender
005
073
002
071
943
138
149
Self-rated health
000
295
035
284
8.471
226
363
ASOC
000
887
074
405
11.972
741
1.032
a Dependent Variable: ALS
Expert Solution
This question has been solved!
Explore an expertly crafted, step-by-step solution for a thorough understanding of key concepts.

Step by step
Solved in 2 steps

Recommended textbooks for you
Algebra & Trigonometry with Analytic Geometry
Algebra
ISBN:
9781133382119
Author:
Swokowski
Publisher:
Cengage

Linear Algebra: A Modern Introduction
Algebra
ISBN:
9781285463247
Author:
David Poole
Publisher:
Cengage Learning

Big Ideas Math A Bridge To Success Algebra 1: Stu…
Algebra
ISBN:
9781680331141
Author:
HOUGHTON MIFFLIN HARCOURT
Publisher:
Houghton Mifflin Harcourt
Algebra & Trigonometry with Analytic Geometry
Algebra
ISBN:
9781133382119
Author:
Swokowski
Publisher:
Cengage
Linear Algebra: A Modern Introduction
Algebra
ISBN:
9781285463247
Author:
David Poole
Publisher:
Cengage Learning
Big Ideas Math A Bridge To Success Algebra 1: Stu…
Algebra
ISBN:
9781680331141
Author:
HOUGHTON MIFFLIN HARCOURT
Publisher:
Houghton Mifflin Harcourt

Glencoe Algebra 1, Student Edition, 9780079039897…
Algebra
ISBN:
9780079039897
Author:
Carter
Publisher:
McGraw Hill

Holt Mcdougal Larson Pre-algebra: Student Edition…
Algebra
ISBN:
9780547587776
Author:
HOLT MCDOUGAL
Publisher:
HOLT MCDOUGAL