Determine if a Z-test, or a T-test should be performed. 3) A researcher would like to determine if college students get less than 8 hours of sleep per night on average. From a survey of 200 adult college students, the mean number of hours of sleep that a student gets per night was 7.58 hours with a sample standard deviation of 1.2 hours. What test should be performed: z-test or t-test 4) According to a certain credit card company the average credit card debt for all of their customers is $4500 with a standard deviation of $700. From a random sample of 50 of their customers, the average debt was $4250. What test should be performed: z-test or t-test
Determine if a Z-test, or a T-test should be performed. 3) A researcher would like to determine if college students get less than 8 hours of sleep per night on average. From a survey of 200 adult college students, the mean number of hours of sleep that a student gets per night was 7.58 hours with a sample standard deviation of 1.2 hours. What test should be performed: z-test or t-test 4) According to a certain credit card company the average credit card debt for all of their customers is $4500 with a standard deviation of $700. From a random sample of 50 of their customers, the average debt was $4250. What test should be performed: z-test or t-test

MATLAB: An Introduction with Applications
6th Edition
ISBN:9781119256830
Author:Amos Gilat
Publisher:Amos Gilat
Chapter1: Starting With Matlab
Section: Chapter Questions
Problem 1P

Related questions
Question
3 and 4?
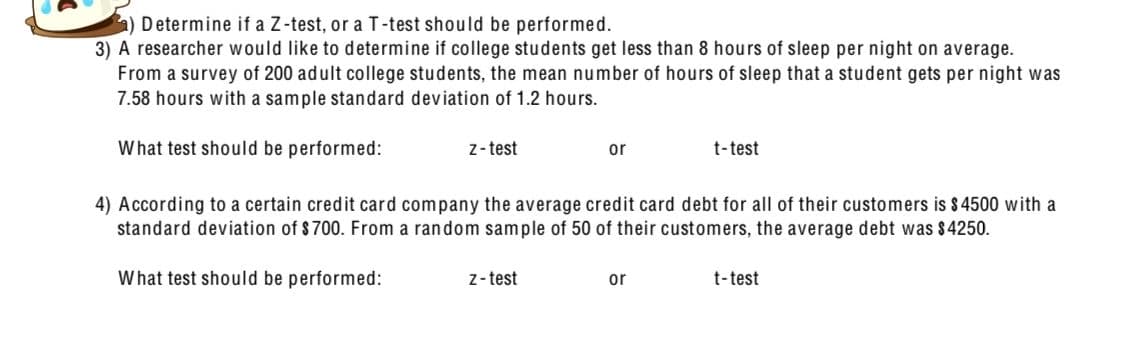
Transcribed Image Text:Determine if a Z-test, or a T-test should be performed.
3) A researcher would like to determine if college students get less than 8 hours of sleep per night on average.
From a survey of 200 adult college students, the mean number of hours of sleep that a student gets per night was
7.58 hours with a sample standard deviation of 1.2 hours.
What test should be performed:
z-test
or
t-test
4) According to a certain credit card company the average credit card debt for all of their customers is $4500 with a
standard deviation of $700. From a random sample of 50 of their customers, the average debt was $4250.
What test should be performed:
z-test
or
t-test
Expert Solution
This question has been solved!
Explore an expertly crafted, step-by-step solution for a thorough understanding of key concepts.

Step by step
Solved in 2 steps

Recommended textbooks for you
MATLAB: An Introduction with Applications
Statistics
ISBN:
9781119256830
Author:
Amos Gilat
Publisher:
John Wiley & Sons Inc

Probability and Statistics for Engineering and th…
Statistics
ISBN:
9781305251809
Author:
Jay L. Devore
Publisher:
Cengage Learning

Statistics for The Behavioral Sciences (MindTap C…
Statistics
ISBN:
9781305504912
Author:
Frederick J Gravetter, Larry B. Wallnau
Publisher:
Cengage Learning
MATLAB: An Introduction with Applications
Statistics
ISBN:
9781119256830
Author:
Amos Gilat
Publisher:
John Wiley & Sons Inc
Probability and Statistics for Engineering and th…
Statistics
ISBN:
9781305251809
Author:
Jay L. Devore
Publisher:
Cengage Learning
Statistics for The Behavioral Sciences (MindTap C…
Statistics
ISBN:
9781305504912
Author:
Frederick J Gravetter, Larry B. Wallnau
Publisher:
Cengage Learning

Elementary Statistics: Picturing the World (7th E…
Statistics
ISBN:
9780134683416
Author:
Ron Larson, Betsy Farber
Publisher:
PEARSON

The Basic Practice of Statistics
Statistics
ISBN:
9781319042578
Author:
David S. Moore, William I. Notz, Michael A. Fligner
Publisher:
W. H. Freeman

Introduction to the Practice of Statistics
Statistics
ISBN:
9781319013387
Author:
David S. Moore, George P. McCabe, Bruce A. Craig
Publisher:
W. H. Freeman