Determine the degrees of freedom, find the critical value, and identify the rejection region. What are the degrees of freedom? d.f.=
Determine the degrees of freedom, find the critical value, and identify the rejection region. What are the degrees of freedom? d.f.=

MATLAB: An Introduction with Applications
6th Edition
ISBN:9781119256830
Author:Amos Gilat
Publisher:Amos Gilat
Chapter1: Starting With Matlab
Section: Chapter Questions
Problem 1P

Related questions

Question
Determine the degrees of freedom, find the critical value, and identify the rejection region.
What are the degrees of freedom?
d.f.=
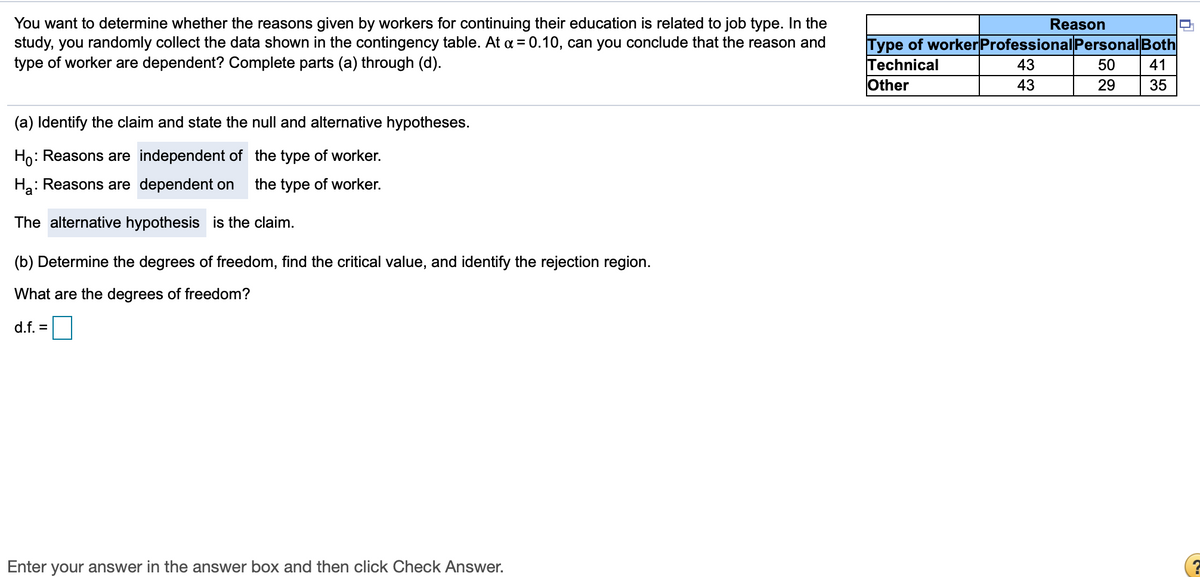
Transcribed Image Text:You want to determine whether the reasons given by workers for continuing their education is related to job type. In the
study, you randomly collect the data shown in the contingency table. At a = 0.10, can you conclude that the reason and
type of worker are dependent? Complete parts (a) through (d).
Reason
Type of workerProfessional Personal Both
Technical
Other
43
50
41
43
29
35
(a) Identify the claim and state the null and alternative hypotheses.
Ho:
: Reasons are independent of the type of worker.
Ha: Reasons are dependent on
the type of worker.
The alternative hypothesis is the claim.
(b) Determine the degrees of freedom, find the critical value, and identify the rejection region.
What are the degrees of freedom?
d.f. =
Enter your answer in the answer box and then click Check Answer.
Expert Solution
This question has been solved!
Explore an expertly crafted, step-by-step solution for a thorough understanding of key concepts.

Step by step
Solved in 5 steps with 2 images

Knowledge Booster


Learn more about
Need a deep-dive on the concept behind this application? Look no further. Learn more about this topic, statistics and related others by exploring similar questions and additional content below.Recommended textbooks for you
MATLAB: An Introduction with Applications
Statistics
ISBN:
9781119256830
Author:
Amos Gilat
Publisher:
John Wiley & Sons Inc

Probability and Statistics for Engineering and th…
Statistics
ISBN:
9781305251809
Author:
Jay L. Devore
Publisher:
Cengage Learning

Statistics for The Behavioral Sciences (MindTap C…
Statistics
ISBN:
9781305504912
Author:
Frederick J Gravetter, Larry B. Wallnau
Publisher:
Cengage Learning
MATLAB: An Introduction with Applications
Statistics
ISBN:
9781119256830
Author:
Amos Gilat
Publisher:
John Wiley & Sons Inc
Probability and Statistics for Engineering and th…
Statistics
ISBN:
9781305251809
Author:
Jay L. Devore
Publisher:
Cengage Learning
Statistics for The Behavioral Sciences (MindTap C…
Statistics
ISBN:
9781305504912
Author:
Frederick J Gravetter, Larry B. Wallnau
Publisher:
Cengage Learning

Elementary Statistics: Picturing the World (7th E…
Statistics
ISBN:
9780134683416
Author:
Ron Larson, Betsy Farber
Publisher:
PEARSON

The Basic Practice of Statistics
Statistics
ISBN:
9781319042578
Author:
David S. Moore, William I. Notz, Michael A. Fligner
Publisher:
W. H. Freeman

Introduction to the Practice of Statistics
Statistics
ISBN:
9781319013387
Author:
David S. Moore, George P. McCabe, Bruce A. Craig
Publisher:
W. H. Freeman