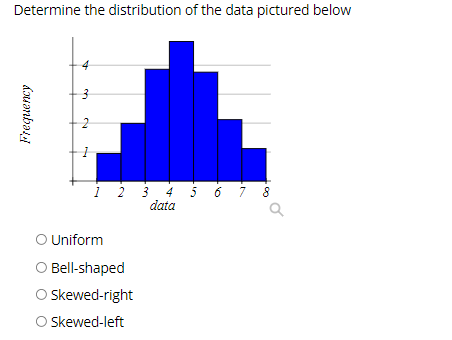
Determine the distribution of the data pictured below 4 i 2 3 4 5 6 7 8 data O Uniform O Bell-shaped O kewed-right Skewed-left


Q: Exhibit 1 Stem-and-leaf of Data: Amount of Money earned in a day in dollars Leaf Unit = 10 N = * 2…
A: Since you have posted a question with multiple sub-parts, we will solve first three subparts for…
Q: B- For data mentioned below, find mean, median, variance, Range, standare deviation, First, second…
A: Data, in ascending order,1,2,3,5,7,8,9,11,13,14,15,16,17,18,19,20,21,22,24,25,26n=0
Q: The scores of students for a quiz are: Student A B D E F Score 37 43 29 47 36 40 (i) Find the…
A: We have given that Let Xi denotes the scores of the students Xi: 37, 43, 29, 47, 36, 40 We have…
Q: Exhibit 1 Stem-and-leaf of Data: Amount of Money earned in a day in dollars Leaf Unit = 10 N = 2 59…
A: If the skewness is between -0.5 and 0.5, the data are fairly symmetrical. If the skewness is between…
Q: 4. Using the frequency distribution table below, what is the proportion of individuals that scored a…
A:
Q: interpret results. Further state the nature of the distribution of each variable in table No.06…
A: Given, A table of output of statistical suummary for distributions. To find, Further state the…
Q: The Wind Mountain excavation site in New Mexico is an important archaeological location of the…
A: The graph shows the depths below surface grade at which significant artifacts were discovered at…
Q: O c. They are an attempt to represent the underlying population distribution
A: Statistical populations tend to trace the empirical distribution: statistical distribution -…
Q: Exhibit 1 Stem-and-leaf of Data: Amount of Money earned in a day in dollars Leaf Unit 10 N = 59 3…
A: Note: Since you have posted a question with multiple sub-parts, we will solve first three sub-parts…
Q: find the percentile for the data value. Data set: 4 13 8 6 4 4 13 6 4 13 2 13 15 5 9 4 12 8 6 13;…
A: Given data, 4 ,13 ,8 ,6 ,4, 4, 13, 6, 4, 13, 2, 13, 15, 5, 9, 4, 12, 8, 6, 13 Sort given data in…
Q: Consider the data set 9. 2 3 8 3 1 2 6. 9. 9. Find the average (mean): Find the median:
A: You have ask multiple questions and you not mention which question you need answer so according…
Q: The following table shows the distribution of daily profits made by a local supermarket over a…
A: Given Data: Mid-point (x) Frequency (f) xf (x-x¯)2 f(x-x¯)2 cf 17 2 34 1122.25 2244.5 2 32 6…
Q: I an not a good 9. Dravel 10 Sorry 8 7- 5- 4 3. 1 80 90 100 110 120 130 140 150 F. How many classes…
A: Histogram is given in the question. Total number of students = 39
Q: What is the shape of the distribution for males and females?
A: Identify the shape of the distribution for males and females.From the given box plot, the X-axis…
Q: Find the variance of the following sample data: 11, 13, 14, 15 and 21 (Write the answer up to 1…
A: Given that 11,13,14,15,21 To find the variance
Q: Calculate the mean of the data set represent via the distribution below. Class Midpoints Frequency 9…
A: Let us denote, x f 9 11 14 8 19 10 24 5 29 6 34 9 Mean: x f x*f 9 11 99…
Q: Calculate the coefficient of variation of a distribution with == 25, *f=21 254 and 2.1= 3804 O…
A:
Q: Exhibit 1 Stem-and-leaf of Data: Amount of Money earned in a day in dollars Leaf Unit 10 N = * 2 59…
A: TO create Box-Whisker plot we find five- number summary. Min, Q1, Q2,Q3 and Max. We can calculate…
Q: The following table shows the distribution of daily profits made by a local supermarket over a…
A: i) One disadvantage of displaying data in groups is that it becomes difficult to read and understand…
Q: What is the mean for the following data? Score Frequency 6 2 7 3 8 7 9 7 10 select one: a.162 b.20…
A: x Frequency (f) f⋅x 6 2 12 7 3 21 8 7 56 9 7 63 10 1 10 --- --- --- n=20 ∑f⋅x=162
Q: For the frequency distribution shown, compute : mean , median , mode , mean deviation , sample…
A:
Q: a) Find the number of customers in this sample who had waist sizes from 30-36 inches. b) Is this…
A:
Q: The weight of all athletes on a college track team (men and women combined). A) Would the…
A: a. The distribution of the weight of all athletes on a college track team both men and women…
Q: 4. Find each value requested for the distribution of scores in the following table. 6 1 5 2 4 2 3 4…
A: Given: The data given is as follows X f 6 1 5 2 4 2 3 4 2 3 1 2
Q: Exhibit 1 Stem-and-leaf of Data: Amount of Money earned in a day in dollars Leaf Unit = 10 N = * 2…
A: Median= Q2 (second quartile) (iv) Q1=(n+1)th term/4 Here n=(34+1)/4th term 9th term Q1=37…
Q: During a winter flu epidemic, waiting times at a student health center were longer than usual. The…
A:
Q: A. Find the mean of the set of data below and construct a sampling distribution, without replacement…
A: Solution-: Given data: xi: 5,8,11,14,17,20 (a) We find the population mean? (b) Complete the given…
Q: Measure the significance of the difference in the height of Chris's friend before and now with a…
A:
Q: 3. Find each value requested for the distribution of scores in the following table. 4 3 3 4 2 5 1 2…
A: a) The number of values are 5, so n=5 b) The value of ∑ix=1+2+3+4+5=15
Q: For a sample of 12 offenders convicted of weapons violations, the length of prison sentence in…
A: Solution-: Given data: 6,6,2,12,17,48,60,24,20,20,18,15 What is the shape of this given…
Q: 11: For the following data, a) mean b) mode c) median
A: Given that The data are 55,57,59,58,60,57,56,58,61,58,59 Note: According to bartleby experts…
Q: When the mean, median and mode are of the same value the distribution should appear symmetric 50 40…
A:
Q: Consider the distribution below. Compute for the mean and variance. 10 20 30 40 50 P(x) 5% 5% 25%…
A: Given data is x 0 10 20 30 40 50 P(x) 5% 5% 25% 20% 30% 15%
Q: Determine the variance for the data below. 8 11 16 12 10 9. 7, 2.
A: The variance is a measure of how far the observations are from the average. The units of the…
Q: The scores of students for a quiz are: Student A B D E F Score 37 43 29 47 36 40 (i) Find the…
A: Formula : Population mean = μ = Σx/n
Q: Create a dotplot for the number of cheeseburgers consumed in a givenweek by 10 college students.4…
A: a.The dot plot for the number of cheeseburgers consumed in a given week by 10 college students is…
Q: % percent of households x 0 1 2 3 4 5 % 3 11 28 39 12 7 Compute the mean of the distribution 1.28…
A:
Q: Determine the distribution of the data pictured below data O Bell-shaped and symmetric O…
A: In question, We have given a picture of box plot. Then we'll find it's shape. The solution is…
Q: Find the mean of the distribution shown below. 3. 7 P(X) 0.21 0.07 0.58 0.14 O 6.23 0.25 O 24
A: To find the mean of the distribution
Q: 10 15 25 30 35 Answer the following questions: The distribution represented 3 points by this box…
A: We have to find correct answer for given data..
Q: Roughuiyatou's clothing store recorded the amounts paid by the sample of 200 customers who made…
A: We know, Relative frequency=Frequency of a given classTotal sum of frequencies The relative…
Q: A store manager is looking at past jewelry sales to determine what sizes of rings to keep in stock.…
A:
Q: ind the mean, median, mode of the distribution below: Class limits 5.1-5.4 10 4.7-5.0 20 4.3 - 4.6…
A: See the handwritten solution
Q: Q. Calculate the mean, median, standard deviation, variance, coefficient of variation, and RSD, for…
A: Obtain the value of mean. The value of mean is obtained below as follows: Use EXCEL Procedure…
Q: Identify the shape of the following distributions: 1. 2. 3. 4. 5.
A: Given that
Q: Exhibit 1 Stem-and-leaf of Data: Amount of Money earned in a day in dollars Leaf Unit = 10 N = * 2 2…
A: Stem-and-leaf data is given with leaf unit 10.
Q: : Calculate the coefficient of skewness for the follow- ing distribution : Central value : 1 2 3 4 6…
A: Given data is Central value 1 2 3 4 5 6 7 8 9 10 Frequency 2 9 11 14 20 24 20 16 5 5
Q: The following data are given to you to find out whether the distribution is platykurtic N= 100, Efd,…
A: Concentration of all the values around the central value of the given data is known as measures of…
Q: Calculate the 13th and 64th percentiles of the data set shown below. 29 18 3 12 17 28 23 21 22 P13…
A: Given that
Q: A stemplot for a set of data is given below. What is the shape of the distribution? Stem Leaf 1 267…
A:


Trending now
This is a popular solution!

Step by step
Solved in 2 steps
