Determine the simple regression model to predict the waiting time Interpret the meaning of the regression coefficient of the independent variable What is the coefficient of determination? Interpret its meaning.
Determine the simple regression model to predict the waiting time Interpret the meaning of the regression coefficient of the independent variable What is the coefficient of determination? Interpret its meaning.

MATLAB: An Introduction with Applications
6th Edition
ISBN:9781119256830
Author:Amos Gilat
Publisher:Amos Gilat
Chapter1: Starting With Matlab
Section: Chapter Questions
Problem 1P

Related questions
Question
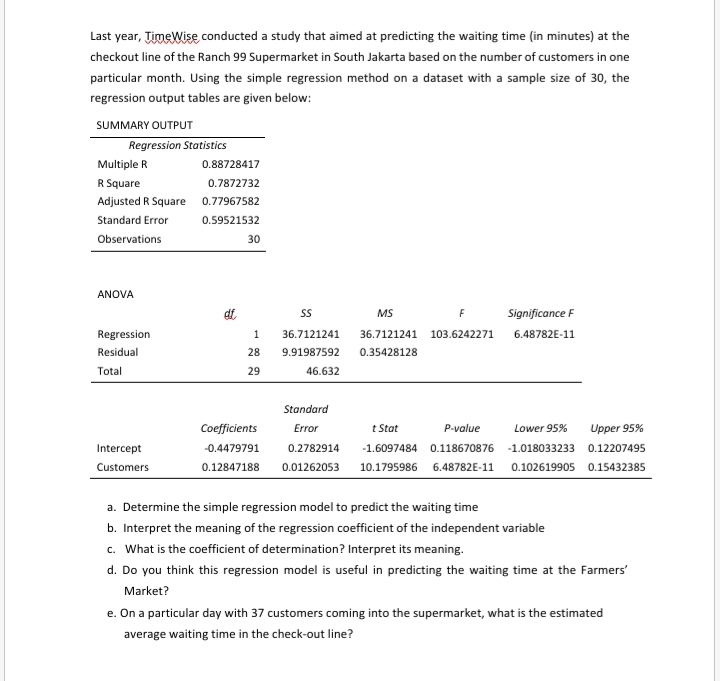
Transcribed Image Text:Last year, TimeWise conducted a study that aimed at predicting the waiting time (in minutes) at the
checkout line of the Ranch 99 Supermarket in South Jakarta based on the number of customers in one
particular month. Using the simple regression method on a dataset with a sample size of 30, the
regression output tables are given below:
SUMMARY OUTPUT
Regression Statistics
Multiple R
0.88728417
R Square
0.7872732
Adjusted R Square 0.77967582
Standard Error
0.59521532
Observations
30
ANOVA
MS
Significance F
Regression
36.7121241
36.7121241 103.6242271
6.48782E-11
Residual
28
9.91987592
0.35428128
Total
29
46.632
Standard
Coefficients
Error
t Stat
P-value
Lower 95%
Upper 95%
Intercept
-0.4479791
0.2782914
-1.6097484
0.118670876 -1.018033233 0.12207495
Customers
0.12847188
0.01262053
10.1795986 6.48782E-11 0.102619905 0.15432385
a. Determine the simple regression model to predict the waiting time
b. Interpret the meaning of the regression coefficient of the independent variable
c. What is the coefficient of determination? Interpret its meaning.
d. Do you think this regression model is useful in predicting the waiting time at the Farmers'
Market?
e. On a particular day with 37 customers coming into the supermarket, what is the estimated
average waiting time in the check-out line?
Expert Solution
This question has been solved!
Explore an expertly crafted, step-by-step solution for a thorough understanding of key concepts.

Step by step
Solved in 4 steps

Recommended textbooks for you
MATLAB: An Introduction with Applications
Statistics
ISBN:
9781119256830
Author:
Amos Gilat
Publisher:
John Wiley & Sons Inc

Probability and Statistics for Engineering and th…
Statistics
ISBN:
9781305251809
Author:
Jay L. Devore
Publisher:
Cengage Learning

Statistics for The Behavioral Sciences (MindTap C…
Statistics
ISBN:
9781305504912
Author:
Frederick J Gravetter, Larry B. Wallnau
Publisher:
Cengage Learning
MATLAB: An Introduction with Applications
Statistics
ISBN:
9781119256830
Author:
Amos Gilat
Publisher:
John Wiley & Sons Inc
Probability and Statistics for Engineering and th…
Statistics
ISBN:
9781305251809
Author:
Jay L. Devore
Publisher:
Cengage Learning
Statistics for The Behavioral Sciences (MindTap C…
Statistics
ISBN:
9781305504912
Author:
Frederick J Gravetter, Larry B. Wallnau
Publisher:
Cengage Learning

Elementary Statistics: Picturing the World (7th E…
Statistics
ISBN:
9780134683416
Author:
Ron Larson, Betsy Farber
Publisher:
PEARSON

The Basic Practice of Statistics
Statistics
ISBN:
9781319042578
Author:
David S. Moore, William I. Notz, Michael A. Fligner
Publisher:
W. H. Freeman

Introduction to the Practice of Statistics
Statistics
ISBN:
9781319013387
Author:
David S. Moore, George P. McCabe, Bruce A. Craig
Publisher:
W. H. Freeman