Determine the upper-tail critical value ta/2 in each of the following circumstances. a. 1-a=0.95, n=13 d. 1-q=0.95, n = 38 b. 1-a=0.99, n=13 e. 1-α=0.90, n = 62 c. 1-α=0.95, n=46 Click here to view page 1 of the table of critical values for the t distribution. Click here to view page 2 of the table of critical values for the t distribution. a. t= (Round to four decimal places as needed.) b. t= (Round to four decimal places as needed.) c. t= (Round to four decimal places as needed.) d. t= (Round to four decimal places as needed.) e.t= (Round to four decimal places as needed.) ***
Determine the upper-tail critical value ta/2 in each of the following circumstances. a. 1-a=0.95, n=13 d. 1-q=0.95, n = 38 b. 1-a=0.99, n=13 e. 1-α=0.90, n = 62 c. 1-α=0.95, n=46 Click here to view page 1 of the table of critical values for the t distribution. Click here to view page 2 of the table of critical values for the t distribution. a. t= (Round to four decimal places as needed.) b. t= (Round to four decimal places as needed.) c. t= (Round to four decimal places as needed.) d. t= (Round to four decimal places as needed.) e.t= (Round to four decimal places as needed.) ***

MATLAB: An Introduction with Applications
6th Edition
ISBN:9781119256830
Author:Amos Gilat
Publisher:Amos Gilat
Chapter1: Starting With Matlab
Section: Chapter Questions
Problem 1P

Related questions
Question
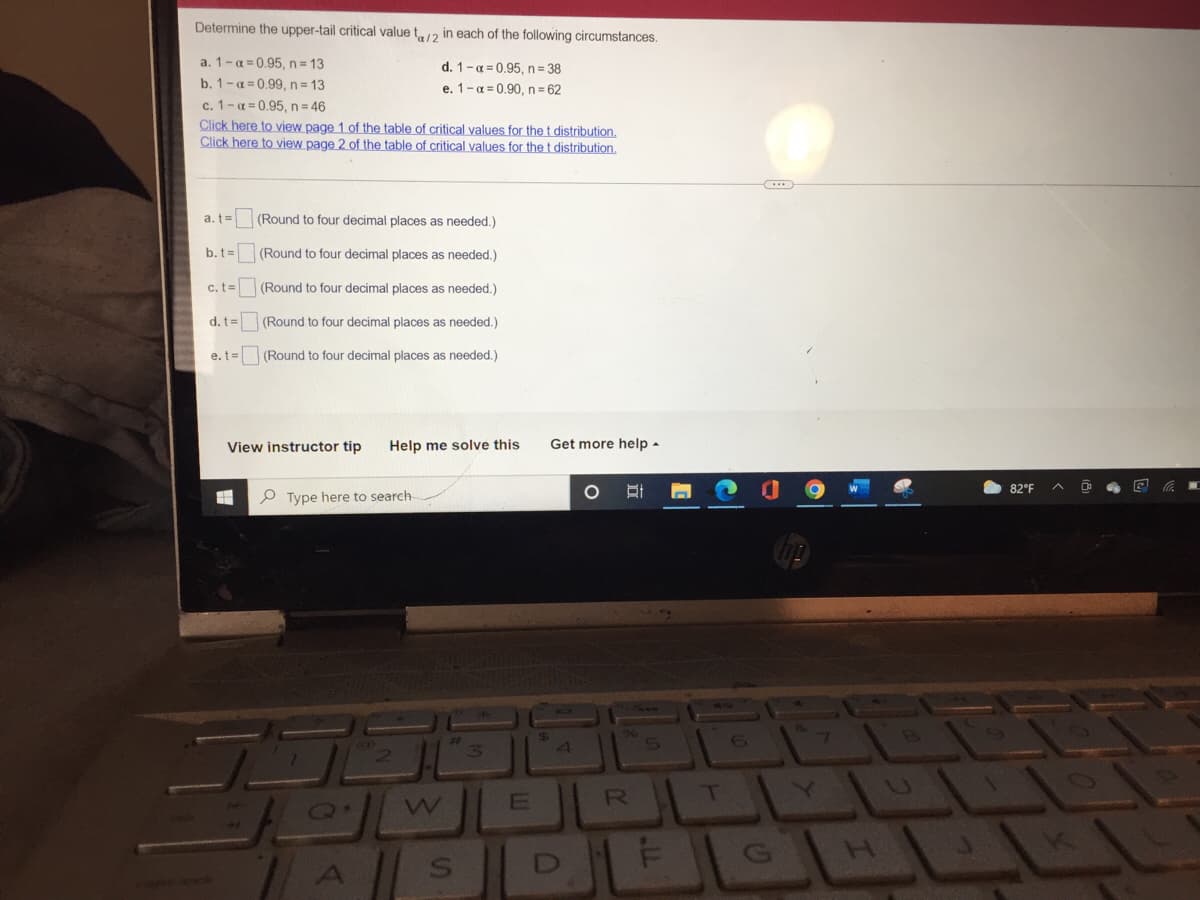
Transcribed Image Text:Determine the upper-tail critical value ta/2 in each of the following circumstances.
a. 1-a=0.95, n = 13
d. 1-q=0.95, n = 38
b. 1-a=0.99, n = 13
e. 1-α=0.90, n=62
c. 1-α=0.95, n = 46
Click here to view page 1 of the table of critical values for the t distribution.
Click here to view page 2 of the table of critical values for the t distribution.
a. t=
(Round to four decimal places as needed.)
b. t=
(Round to four decimal places as needed.)
c. t=
(Round to four decimal places as needed.)
(Round to four decimal places as needed.)
d. t=
e.t=
(Round to four decimal places as needed.)
View instructor tip Help me solve this
Type here to search-
B
Q.
S
E
$
Get more help.
4
C
O
DI
B
R
5
T
82°F
55
U
0
E
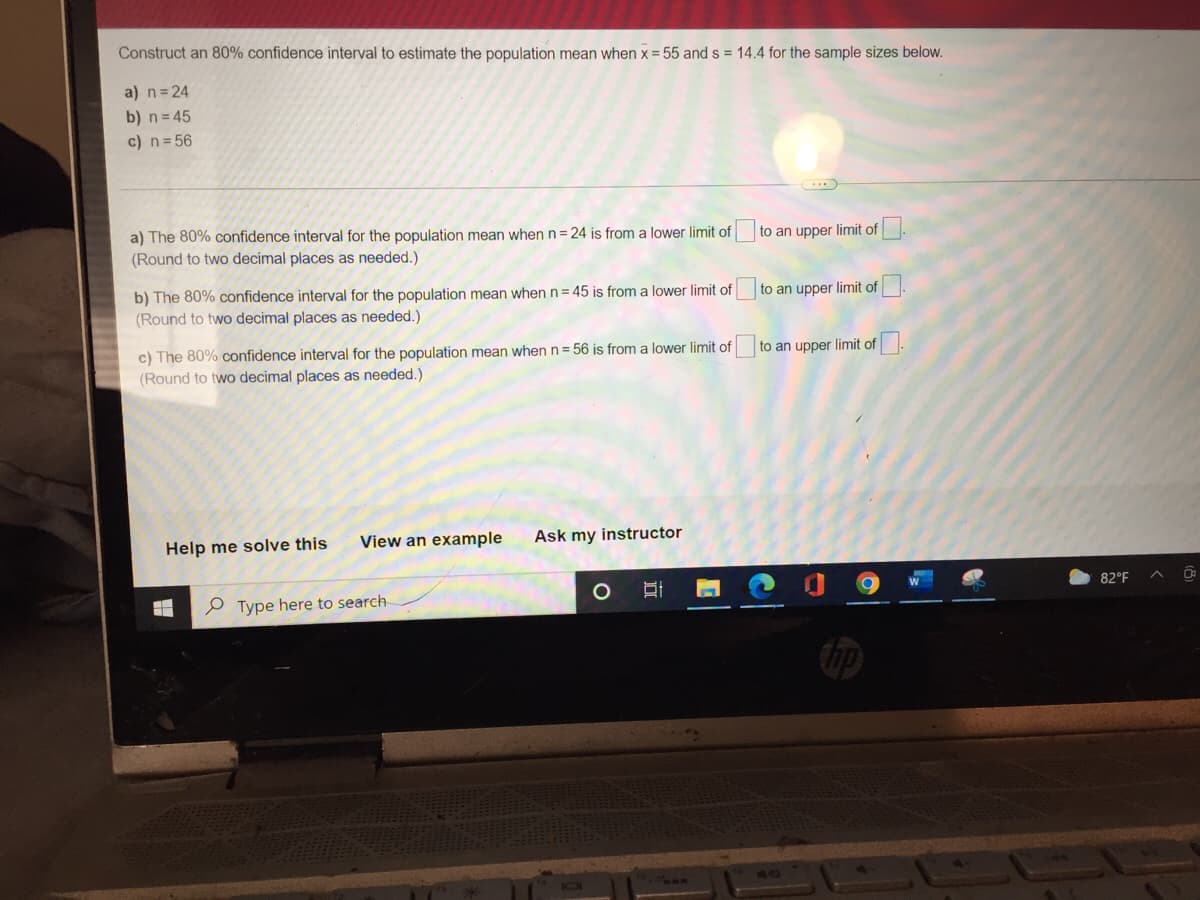
Transcribed Image Text:Construct an 80% confidence interval to estimate the population mean when x = 55 and s = 14.4 for the sample sizes below.
a) n = 24
b) n=45
c) n=56
a) The 80% confidence interval for the population mean when n = 24 is from a lower limit of to an upper limit of
(Round to two decimal places as needed.)
b) The 80% confidence interval for the population mean when n = 45 is from a lower limit of
(Round to two decimal places as needed.)
to an upper limit of
c) The 80% confidence interval for the population mean when n = 56 is from a lower limit of
(Round to two decimal places as needed.)
to an upper limit of
Help me solve this
View an example
Ask my instructor
O
H
Type here to search
82°F
0
Expert Solution
This question has been solved!
Explore an expertly crafted, step-by-step solution for a thorough understanding of key concepts.

This is a popular solution!

Trending now
This is a popular solution!

Step by step
Solved in 3 steps

Recommended textbooks for you
MATLAB: An Introduction with Applications
Statistics
ISBN:
9781119256830
Author:
Amos Gilat
Publisher:
John Wiley & Sons Inc

Probability and Statistics for Engineering and th…
Statistics
ISBN:
9781305251809
Author:
Jay L. Devore
Publisher:
Cengage Learning

Statistics for The Behavioral Sciences (MindTap C…
Statistics
ISBN:
9781305504912
Author:
Frederick J Gravetter, Larry B. Wallnau
Publisher:
Cengage Learning
MATLAB: An Introduction with Applications
Statistics
ISBN:
9781119256830
Author:
Amos Gilat
Publisher:
John Wiley & Sons Inc
Probability and Statistics for Engineering and th…
Statistics
ISBN:
9781305251809
Author:
Jay L. Devore
Publisher:
Cengage Learning
Statistics for The Behavioral Sciences (MindTap C…
Statistics
ISBN:
9781305504912
Author:
Frederick J Gravetter, Larry B. Wallnau
Publisher:
Cengage Learning

Elementary Statistics: Picturing the World (7th E…
Statistics
ISBN:
9780134683416
Author:
Ron Larson, Betsy Farber
Publisher:
PEARSON

The Basic Practice of Statistics
Statistics
ISBN:
9781319042578
Author:
David S. Moore, William I. Notz, Michael A. Fligner
Publisher:
W. H. Freeman

Introduction to the Practice of Statistics
Statistics
ISBN:
9781319013387
Author:
David S. Moore, George P. McCabe, Bruce A. Craig
Publisher:
W. H. Freeman