Determine whether the following graph can represent a variable with a normal distribution. Explain your reasoning. If the graph appears to represent a normal distribution, estimate the mean and standard deviation. 5 10 15 20 25 30 Could the graph represent a variable with a normal distribution? Explain your reasoning. Select the correct choice below and, if necessary, fill in the answer boxes within your choice. O A. Yes, the graph fulfills the properties of the normal distribution. The mean is approximately (Type whole numbers.) and the standard deviation is about O B. No, because the graph is skewed right. O C. No, because the graph is skewed left. O D. No, because the graph crosses the x-axis.
Determine whether the following graph can represent a variable with a normal distribution. Explain your reasoning. If the graph appears to represent a normal distribution, estimate the mean and standard deviation. 5 10 15 20 25 30 Could the graph represent a variable with a normal distribution? Explain your reasoning. Select the correct choice below and, if necessary, fill in the answer boxes within your choice. O A. Yes, the graph fulfills the properties of the normal distribution. The mean is approximately (Type whole numbers.) and the standard deviation is about O B. No, because the graph is skewed right. O C. No, because the graph is skewed left. O D. No, because the graph crosses the x-axis.

Glencoe Algebra 1, Student Edition, 9780079039897, 0079039898, 2018
18th Edition
ISBN:9780079039897
Author:Carter
Publisher:Carter
Chapter10: Statistics
Section10.3: Measures Of Spread
Problem 26PFA

Related questions
Question
Transcribed Image Text:JUST
INT
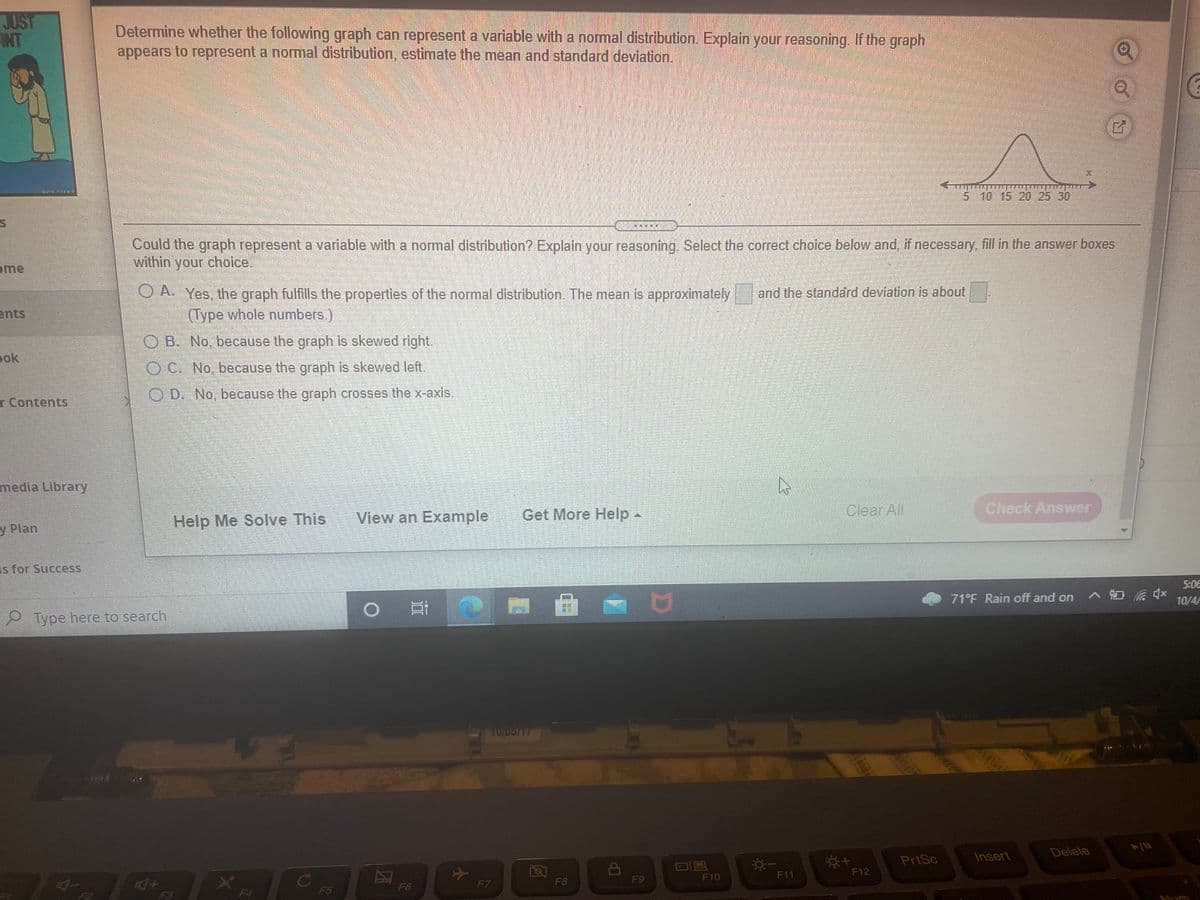
Determine whether the following graph can represent a variable with a normal distribution. Explain your reasoning. If the graph
appears to represent a normal distribution, estimate the mean and standard deviation.
5 10 15 20 25 30
Could the graph represent a variable with a normal distribution? Explain your reasoning. Select the correct choice below and, if necessary, fill in the answer boxes
within your choice.
ome
and the standard deviation is about
O A. Yes, the graph fulfills the properties of the normal distribution. The mean is approximately
(Type whole numbers.)
ents
O B. No, because the graph is skewed right.
pok
O C. No, because the graph is skewed left.
O D. No, because the graph crosses the x-axis.
T Contents
media Library
View an Example
Get More Help-
Clear All
Check Answver
Help Me Solve This
y Plan
Is for Success
5:06
71°F Rain off and on A a qx 10
Type here to search
Insert
Delete
PrtSc
F11
F12
F8
F9
F10
F6
F7
F3
F4
F5
LEGO
小
14
Expert Solution
This question has been solved!
Explore an expertly crafted, step-by-step solution for a thorough understanding of key concepts.

This is a popular solution!

Trending now
This is a popular solution!

Step by step
Solved in 2 steps with 1 images

Recommended textbooks for you
Glencoe Algebra 1, Student Edition, 9780079039897…
Algebra
ISBN:
9780079039897
Author:
Carter
Publisher:
McGraw Hill

Big Ideas Math A Bridge To Success Algebra 1: Stu…
Algebra
ISBN:
9781680331141
Author:
HOUGHTON MIFFLIN HARCOURT
Publisher:
Houghton Mifflin Harcourt
Glencoe Algebra 1, Student Edition, 9780079039897…
Algebra
ISBN:
9780079039897
Author:
Carter
Publisher:
McGraw Hill
Big Ideas Math A Bridge To Success Algebra 1: Stu…
Algebra
ISBN:
9781680331141
Author:
HOUGHTON MIFFLIN HARCOURT
Publisher:
Houghton Mifflin Harcourt