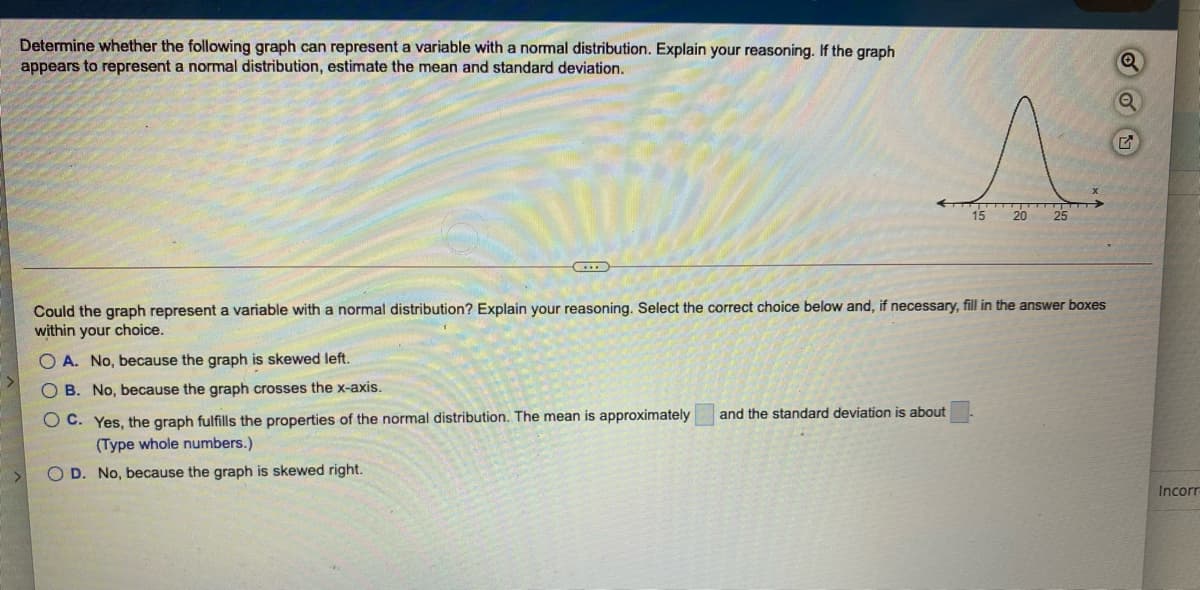
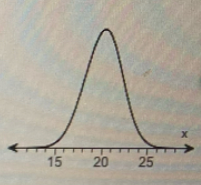
Determine whether the following graph can represent a variable with a normal distribution. Explain your reasoning. If the graph appears to represent a normal distribution, estimate the mean and standard deviation. 15 20 25 Could the graph represent a variable with a normal distribution? Explain your reasoning. Select the correct choice below and, if necessary, fill in the answer boxes within your choice. O A. No, because the graph is skewed left. O B. No, because the graph crosses the x-axis. O C. Yes, the graph fulfills the properties of the normal distribution. The mean is approximately (Type whole numbers.) and the standard deviation is about O D. No, because the graph is skewed right.
Determine whether the following graph can represent a variable with a normal distribution. Explain your reasoning. If the graph appears to represent a normal distribution, estimate the mean and standard deviation. 15 20 25 Could the graph represent a variable with a normal distribution? Explain your reasoning. Select the correct choice below and, if necessary, fill in the answer boxes within your choice. O A. No, because the graph is skewed left. O B. No, because the graph crosses the x-axis. O C. Yes, the graph fulfills the properties of the normal distribution. The mean is approximately (Type whole numbers.) and the standard deviation is about O D. No, because the graph is skewed right.

Glencoe Algebra 1, Student Edition, 9780079039897, 0079039898, 2018
18th Edition
ISBN:9780079039897
Author:Carter
Publisher:Carter
Chapter10: Statistics
Section10.5: Comparing Sets Of Data
Problem 19PPS

Related questions
Question
Transcribed Image Text:Determine whether the following graph can represent a variable with a normal distribution. Explain your reasoning. If the graph
appears to represent a normal distribution, estimate the mean and standard deviation.
20
25
Could the graph represent a variable with a normal distribution? Explain your reasoning. Select the correct choice below and, if necessary, fill in the answer boxes
within your choice.
O A. No, because the graph is skewed left.
O B. No, because the graph crosses the x-axis.
O C. Yes, the graph fulfills the properties of the normal distribution. The mean is approximately
(Type whole numbers.)
and the standard deviation is about
O D. No, because the graph is skewed right.
Incorr
Expert Solution
Step 1

Trending now
This is a popular solution!

Step by step
Solved in 2 steps with 1 images

Recommended textbooks for you
Glencoe Algebra 1, Student Edition, 9780079039897…
Algebra
ISBN:
9780079039897
Author:
Carter
Publisher:
McGraw Hill

Big Ideas Math A Bridge To Success Algebra 1: Stu…
Algebra
ISBN:
9781680331141
Author:
HOUGHTON MIFFLIN HARCOURT
Publisher:
Houghton Mifflin Harcourt
Glencoe Algebra 1, Student Edition, 9780079039897…
Algebra
ISBN:
9780079039897
Author:
Carter
Publisher:
McGraw Hill
Big Ideas Math A Bridge To Success Algebra 1: Stu…
Algebra
ISBN:
9781680331141
Author:
HOUGHTON MIFFLIN HARCOURT
Publisher:
Houghton Mifflin Harcourt