Test scores Mean Median Mode Score Frequency Relative Frequency 16 INSTRUCTIONS 15.5 Save a copy of this file and include your name in the filename. Upload the file to Blackboard at the end of class. 14.5 18.5 22 1. Find the mean, median, and mode for the test scores. Write 16 your own formula for the mean. You should be able to find the median and mode by scanning through the data. It will help if you sort the data first from lowest to highest. 17 21 18 15 2. Rearrange the data into a frequency table in the "Score" and "Frequency" columns given from lowest score to highest. 16 20.5 19.5 3. The score column should be ranges and the frequency will be the number of test scores in each range. How many data 19.5 14 ranges should you use? 17 19.5 4. Select all the cells in the frequency table data. Then select Insert and choose 2D Column Chart. This will create a 17 21.5 histogram from your data. 12 5. Explain your decisions for creating the frequency table and histogram here: 17.5 18.5 19.5 20.5 22 17.5 20 14.5 20 22.5 18 16.5 20.5 22 16 16.5 19.5 18.5 21 21 17.5 CI
Test scores Mean Median Mode Score Frequency Relative Frequency 16 INSTRUCTIONS 15.5 Save a copy of this file and include your name in the filename. Upload the file to Blackboard at the end of class. 14.5 18.5 22 1. Find the mean, median, and mode for the test scores. Write 16 your own formula for the mean. You should be able to find the median and mode by scanning through the data. It will help if you sort the data first from lowest to highest. 17 21 18 15 2. Rearrange the data into a frequency table in the "Score" and "Frequency" columns given from lowest score to highest. 16 20.5 19.5 3. The score column should be ranges and the frequency will be the number of test scores in each range. How many data 19.5 14 ranges should you use? 17 19.5 4. Select all the cells in the frequency table data. Then select Insert and choose 2D Column Chart. This will create a 17 21.5 histogram from your data. 12 5. Explain your decisions for creating the frequency table and histogram here: 17.5 18.5 19.5 20.5 22 17.5 20 14.5 20 22.5 18 16.5 20.5 22 16 16.5 19.5 18.5 21 21 17.5 CI

Glencoe Algebra 1, Student Edition, 9780079039897, 0079039898, 2018
18th Edition
ISBN:9780079039897
Author:Carter
Publisher:Carter
Chapter10: Statistics
Section10.3: Measures Of Spread
Problem 14PPS

Related questions
Question
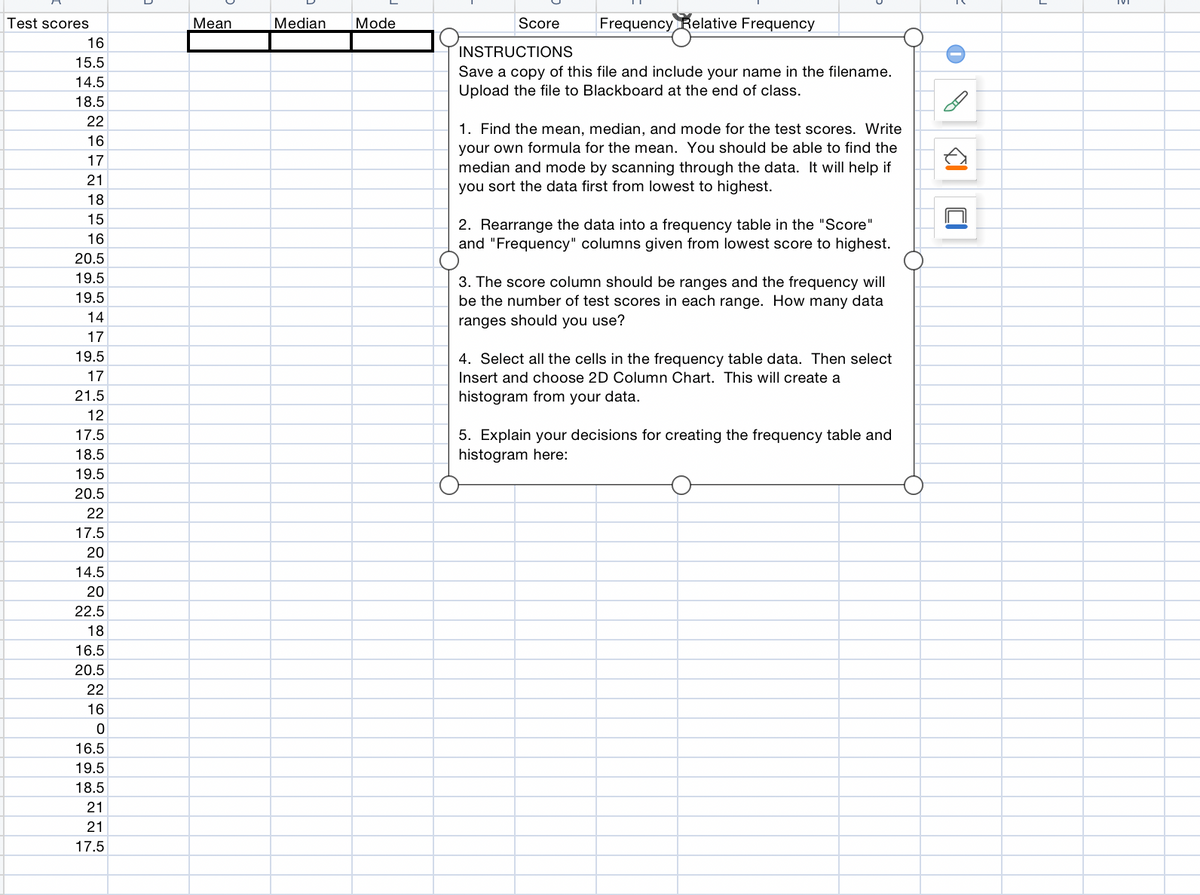
Transcribed Image Text:Test scores
Mean
Median
Mode
Score
Frequency Relative Frequency
16
INSTRUCTIONS
15.5
Save a copy of this file and include your name in the filename.
Upload the file to Blackboard at the end of class.
14.5
18.5
22
1. Find the mean, median, and mode for the test scores. Write
your own formula for the mean. You should be able to find the
median and mode by scanning through the data. It will help if
you sort the data first from lowest to highest.
16
17
21
18
15
2. Rearrange the data into a frequency table in the "Score"
and "Frequency" columns given from lowest score to highest.
16
20.5
19.5
3. The score column should be ranges and the frequency will
be the number of test scores in each range. How many data
19.5
14
ranges should you use?
17
19.5
4. Select all the cells in the frequency table data. Then select
17
Insert and choose 2D Column Chart. This will create a
21.5
histogram from your data.
12
5. Explain your decisions for creating the frequency table and
histogram here:
17.5
18.5
19.5
20.5
22
17.5
20
14.5
20
22.5
18
16.5
20.5
22
16
16.5
19.5
18.5
21
21
17.5
Expert Solution
Step 1
"Since you have asked multiple questions, we will solve the first question for you. If you want any specific question to be solved then please specify the question number or post only that question."

Trending now
This is a popular solution!

Step by step
Solved in 4 steps

Recommended textbooks for you
Glencoe Algebra 1, Student Edition, 9780079039897…
Algebra
ISBN:
9780079039897
Author:
Carter
Publisher:
McGraw Hill

Big Ideas Math A Bridge To Success Algebra 1: Stu…
Algebra
ISBN:
9781680331141
Author:
HOUGHTON MIFFLIN HARCOURT
Publisher:
Houghton Mifflin Harcourt

Glencoe Algebra 1, Student Edition, 9780079039897…
Algebra
ISBN:
9780079039897
Author:
Carter
Publisher:
McGraw Hill
Big Ideas Math A Bridge To Success Algebra 1: Stu…
Algebra
ISBN:
9781680331141
Author:
HOUGHTON MIFFLIN HARCOURT
Publisher:
Houghton Mifflin Harcourt