Determine whether the graph shown could represent a variable with a nomal distribution. Explain your reasoning. If the graph appears to represent a normal distribution, estimate the mean and standard deviation. E 345 67 Select the correct choice below and, if necessary, fill in the answer boxes complete your choice. O A. The graph could not represent a variable with a normal distribution because the curve is constant. O B. The graph could not represent a variable with a normal distribution because the graph is skewed to the left. O C. The graph could not represent a variable with a normal distribution because the curve has two modes. O D. The graph could not represent a variable with a normal distribution because the graph is skewed to the right. O E. The graph could not represent a variable with a normal distribution because the curve crosses the x-axis. O F. The graph could represent a variable with a normal distribution because the curve is symmetric and bell-shaped. Its mean is approximately. and its standard deviation is approximately. (Round to one decimal place as needed.)
Determine whether the graph shown could represent a variable with a nomal distribution. Explain your reasoning. If the graph appears to represent a normal distribution, estimate the mean and standard deviation. E 345 67 Select the correct choice below and, if necessary, fill in the answer boxes complete your choice. O A. The graph could not represent a variable with a normal distribution because the curve is constant. O B. The graph could not represent a variable with a normal distribution because the graph is skewed to the left. O C. The graph could not represent a variable with a normal distribution because the curve has two modes. O D. The graph could not represent a variable with a normal distribution because the graph is skewed to the right. O E. The graph could not represent a variable with a normal distribution because the curve crosses the x-axis. O F. The graph could represent a variable with a normal distribution because the curve is symmetric and bell-shaped. Its mean is approximately. and its standard deviation is approximately. (Round to one decimal place as needed.)

Glencoe Algebra 1, Student Edition, 9780079039897, 0079039898, 2018
18th Edition
ISBN:9780079039897
Author:Carter
Publisher:Carter
Chapter10: Statistics
Section10.4: Distributions Of Data
Problem 22PFA

Related questions
Question
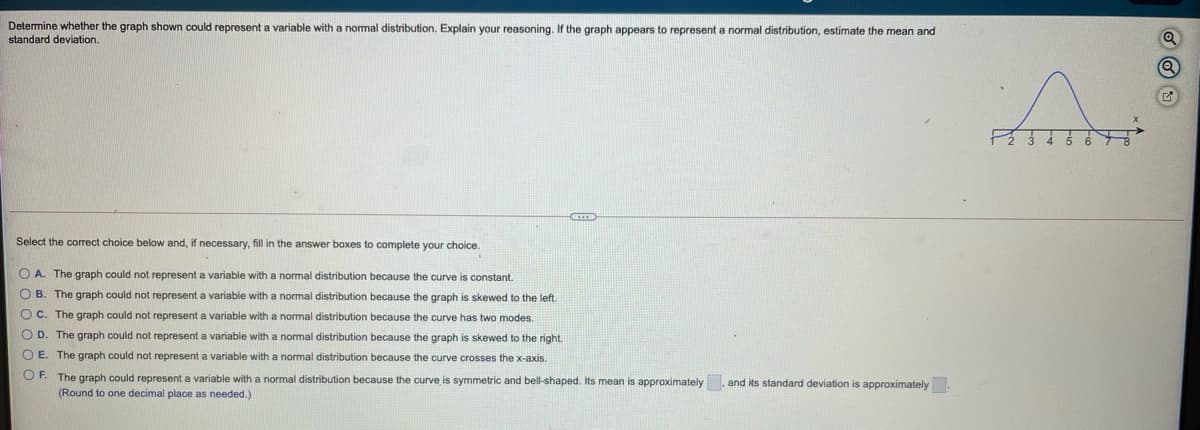
Transcribed Image Text:Determine whether the graph shown could represent a variable with a nomal distribution. Explain your reasoning. If the graph appears to represent a normal distribution, estimate the mean and
standard deviation.
Select the correct choice below and, if necessary, fill in the answer boxes
complete your choice.
O A. The graph could not represent a variable with a normal distribution because the curve is constant.
O B. The graph could not represent a variable with a normal distribution because the graph is skewed to the left.
O C. The graph could not represent a variable with a normal distribution because the curve has two modes.
O D. The graph could not represent a variable with a normal distribution because the graph is skewed to the right.
O E. The graph could not represent a variable with a normal distribution because the curve crosses the x-axis.
O F. The graph could represent a variable with a normal distribution because the curve is symmetric and bell-shaped. Its mean is approximately, and its standard deviation is approximately.
(Round to one decimal place as needed.)
Expert Solution
Step 1
Determine whether the graph shown could represent a variable with normal distribution.Explain your reasoning .

Trending now
This is a popular solution!

Step by step
Solved in 2 steps

Recommended textbooks for you
Glencoe Algebra 1, Student Edition, 9780079039897…
Algebra
ISBN:
9780079039897
Author:
Carter
Publisher:
McGraw Hill

Big Ideas Math A Bridge To Success Algebra 1: Stu…
Algebra
ISBN:
9781680331141
Author:
HOUGHTON MIFFLIN HARCOURT
Publisher:
Houghton Mifflin Harcourt

Holt Mcdougal Larson Pre-algebra: Student Edition…
Algebra
ISBN:
9780547587776
Author:
HOLT MCDOUGAL
Publisher:
HOLT MCDOUGAL
Glencoe Algebra 1, Student Edition, 9780079039897…
Algebra
ISBN:
9780079039897
Author:
Carter
Publisher:
McGraw Hill
Big Ideas Math A Bridge To Success Algebra 1: Stu…
Algebra
ISBN:
9781680331141
Author:
HOUGHTON MIFFLIN HARCOURT
Publisher:
Houghton Mifflin Harcourt
Holt Mcdougal Larson Pre-algebra: Student Edition…
Algebra
ISBN:
9780547587776
Author:
HOLT MCDOUGAL
Publisher:
HOLT MCDOUGAL