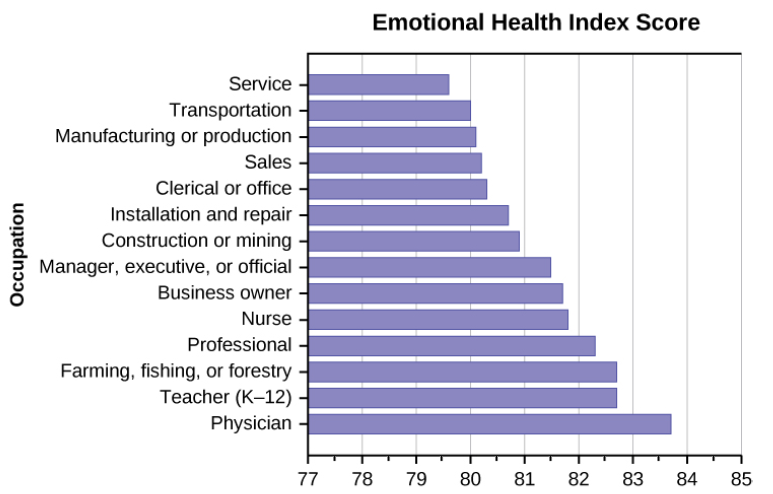
Service Transportation Manufacturing or production Sales Clerical or office Installation and repair Construction or mining Manager, executive, or official Business owner Nurse Professional Farming, fishing, or forestry Teacher (K–12) Physician


Q: Find the missing frequency in the group 20–30 when median is given to be 28. 0-10 10-20 20-30 30-40 ...
A: We have given that Group 20-30 when median is 28 We have to find the missing frequency of class int...
Q: In order to test the null hypothesis, the t calculated is equal to: O 3.895 O 3.878 O 3.932 O 3.914
A: Given data : X(Income ) Y(education ) 30 12 28 12 52 18 40 16 35 16
Q: Table 2: Significant Relationship between Management Capability and Productivity of Employees Produc...
A: Given information: The null and alternative hypotheses are: H0:There is no significance re...
Q: Q. 5. Calculate regression equation by the method of least square and take deviation from actual mea...
A:
Q: A coefficient of correlation of 0-2 is derived from a random sample of 625 pairs of Abservations: (i...
A: The association between the two variable is calculated using the correlation measure. It explains th...
Q: One way to take samples from the field is by using Quadrats. How is it done? Give a specific example...
A: Given information: It is required to give an example for Quadrats.
Q: Calculate regression equations from the following infcrma- tions: Values of x = 4 6 10 12 Values of ...
A:
Q: – 0.85, Suppose you have joint random variables X and Y. It is found that COV(X,Y) Var(X) = 8, and V...
A: GivenCOV(X,Y)=-0.85Var(X)=8Var(Y)=5
Q: Find the mean for the given sample data. Unless indicated otherwise, round your answer to one more d...
A:
Q: 1. Suppose a population consists of the numbers 2,3,5,8 and 12. What is the mean of the population? ...
A: Note: Hey, since there are multiple questions posted, as per guidelines we will answer first questio...
Q: Calculate the co-efficient of correlation and the lines of regression for the following data: 1 2 3 ...
A: Given that X Y 1 9 2 8 3 10 4 12 5 11 6 13 7 14 8 16 9 15
Q: 1) A mail-order company has a goal of reducing the amount of time a customer has to wait in order to...
A: WHY-WHY diagram determines the root cause of a problem by narrowing down and eliminate possible caus...
Q: The mean yield of wheat from a district A was 210 tbs. with S.D.= 10 lbs. per acre from sample of 15...
A: Any assumption about the parameter or probability function is known as Hypothesis testing. For the g...
Q: Q. 3. Calculate regression line of y on x and plot it: Weight of father x: 60 64 70 70 73 75 80 82 W...
A: Data X: 60,64,70,70,73,75,80,82 Y: 70,73,60,73,82,82,75,81
Q: 2. An educator wants to determine whether early exposure school will affect IQ. He enlists the aid o...
A: The t test is used to determine the mean significance between the sample and population. It is used ...
Q: The mean yield of two sets of plots and their variability are as given below. Examine whether the di...
A:
Q: Describe T schuprow's Coefficeint
A:
Q: From Open Intro Statistics) The National Survey of Family Growth conducted by the Center for Disease...
A:
Q: Let X = the number of games won in that upcoming month. What is the probability that the San Jose Sh...
A:
Q: Calculate Harmonic mean from the following values : 9, 17, 23, 42, 56, 67, 72.
A:
Q: a. at 95% level of confidence, is there enough evidence to day that there will be no sales for a wee...
A: Given Information: Consider the data that shows the sample of ads budget and sales per week.
Q: As part of a study designed to compare hybrid and similarly equipped conventional vehicles, a group ...
A: For the given data using Anova: Two-Factor With Replication carry out the hypotheses test at alpha =...
Q: respect to the mean 0, such that: The probability that the variable is greater than a and less than...
A:
Q: The variable Z is normally distributed with mean 0 and standard deviation 1. Find the value a such t...
A: Let the variable Z is normally distributed with mean μ=0 and standard deviation σ=1. The probabilit...
Q: Times for a surgical procedure are normally distributed. There are two methods. Method A has a mean ...
A: Given : Times for a surgical procedure are normally distributed Method A has a mean of 25 minutes an...
Q: In how many different ways can the following letters be arranged so that the vowels always come toge...
A: According to Bartleby guildlines we have to solve first three subparts and rest can be reposted.... ...
Q: Prove that for a random sample of size n, X, X2 X, taken from a finite population s - (, - i) Σ n i=...
A:
Q: According to the Pak Car Dealers, the mean price for used cars isRs. 900,000. A Firm reviewed a samp...
A: Given Data National mean=900000
Q: 1.Given l4 = 100 and l9 = 50. Calculate l5 assuming a Uniform Distribution of Death (UDD) Inform...
A: Given: l4= 100 and l9 =50 under Uniform distribution of death. To determine: l5
Q: Prove that for a random sample of size n, X,, X, X, taken from a finite population s? = n i=1 is not...
A:
Q: The price index and quantity index of a commodity were 120 and 110 respectively in 2005 with base 20...
A: Given information: The price index and quantity index of a commodity were 120 and 110, respectively ...
Q: How do you classify the distribution 15, 30, 18, 18, 27, 15, 15, 30, 18 based on its mode? Multimoda...
A:
Q: Cross out salaries for Company F and Company G. What is mean and median for the set of Companies A ...
A: Given information: Salaries A 33000 A 34500 A 36000 A 43500 B 33000 B 33000 B 36...
Q: For 10 observations on price (p) and supply (S) the following data were obtained (in appropriate uni...
A:
Q: Define Non parametric test. Discuss the advantages and disadvantages.
A:
Q: Solve the problem by using Pearson r
A: Given: STUDENT X Y A 5 6 B 7 15 C 9 16 D 10 12 E 11 21 F 12 22 G 15 8 H 17 27 ...
Q: Is HDTV ownership related to quantity of purchases of other electronics? A Best Buy retail outlet co...
A: The Chi square test is used to check the independence between two categorical variables. The followi...
Q: Acceptedcharacters:numbers, decimal point markers (period or comma), sign indicators (-),spaces (e.g...
A: In order to obtain the probability within the specified random variable (i.e., the amount a selected...
Q: 6. A ski coach claims that she can train beginning skiers for 3 weeks so that at the end of the prog...
A:
Q: A radio shop sells, on an verage, 200 radios per day with a standard deviation of 50 radios After an...
A: The z test is used to determine the mean significance relationship between the sample and the popula...
Q: Below are numbers of hours that a sample of 19 college graduates reported working last week. 61, 69,...
A:
Q: The average price of a college math textbook is $178 and the standard deviation is $24. Suppose that...
A:
Q: You are given the following information relating to a frequency distribution comprising 10 observati...
A: We have given that We have to find the correlation coefficient between X and Y :
Q: The spotted lanternfly, Lycorma delicatula, is an invasive species to the United States that has the...
A: Given that Length of insect: AVG = 1 inch, SD = 0.15 inchNumber of eggs: AVG = 40 eggs, SD = 5 eggsr...
Q: ASSIGNMENT Show that each of the following is a pmf. E. if x€ {1,3} 0, otherwise if x € {1,2, 3,4,5,...
A: The objective is to show that the functions are pmf.
Q: Two people A and B play a series of games, in which they bet on a particular share price increasing ...
A: Since you have posted a question with multiple sub-parts, we will solve first three sub-parts for yo...
Q: CASE: You want to determine the degree/strength of relationship between height and weight. Variable ...
A:
Q: The variable Z is normally distributed with mean 0 and standard deviation 1. Find the value a such t...
A: Given that Mean(µ) = 0Standard deviations (σ) = 1X ~ N (µ, σ )= N( 0,1)
Q: Instruction: Covert the following in z scores and construct the normal curve 1. X = 80, X, = 85, u =...
A:
Q: The average healing time of a certain type of incision is 288 hours, with standard deviation of 30 h...
A: Here is given that mean is 288 and standard deviation is 30 For 10 days is equal to 10*24 = 240 We w...
The graph shown is based on more than 170,000 interviews done by Gallup that took place from January through December 2012. The sample consists of employed Americans 18 years of age or older. The Emotional Health Index Scores are the

Trending now
This is a popular solution!

Step by step
Solved in 2 steps with 2 images

- Population Genetics In the study of population genetics, an important measure of inbreeding is the proportion of homozygous genotypesthat is, instances in which the two alleles carried at a particular site on an individuals chromosomes are both the same. For population in which blood-related individual mate, them is a higher than expected frequency of homozygous individuals. Examples of such populations include endangered or rare species, selectively bred breeds, and isolated populations. in general. the frequency of homozygous children from mating of blood-related parents is greater than that for children from unrelated parents Measured over a large number of generations, the proportion of heterozygous genotypesthat is, nonhomozygous genotypeschanges by a constant factor 1 from generation to generation. The factor 1 is a number between 0 and 1. If 1=0.75, for example then the proportion of heterozygous individuals in the population decreases by 25 in each generation In this case, after 10 generations, the proportion of heterozygous individuals in the population decreases by 94.37, since 0.7510=0.0563, or 5.63. In other words, 94.37 of the population is homozygous. For specific types of matings, the proportion of heterozygous genotypes can be related to that of previous generations and is found from an equation. For mating between siblings 1 can be determined as the largest value of for which 2=12+14. This equation comes from carefully accounting for the genotypes for the present generation the 2 term in terms of those previous two generations represented by for the parents generation and by the constant term of the grandparents generation. a Find both solutions to the quadratic equation above and identify which is 1 use a horizontal span of 1 to 1 in this exercise and the following exercise. b After 5 generations, what proportion of the population will be homozygous? c After 20 generations, what proportion of the population will be homozygous?Football and Brain SizeA study examines a possible relationship of football playing and concussions on hippocampus volume, in μL, in the brain. The study included three groups: controls who had never played football (Control), football players with no history of concussions (FBNoConcuss), and football players with a history of concussions (FBConcuss). The data is available in FootballBrain, and the side-by-side boxplots shown below indicate that the conditions for using the F-distribution appear to be met. b) Use technology to construct an ANOVA table. What is the F-statistic? What is the p-value? Round your answer for the F-statistic to two decimal places, and your answer for the p-value to three decimal places.F-statistic = ?p-value = ? Group Hipp LeftHipp Years Cogniton Control 6175 2945 0 Control 6220 3075 0 Control 6360 3125 0 Control 6465 3160 0 Control 6540 3205 0 Control 6780 3340 0…A researcher wants to see if gender and/or income affect the total amount of help given to a stranger who is sitting on the side of a busy road with a sign asking for help. The independent variables are gender, income, and the interaction of gender and income. The dependent variable is total help. He wants to know if one or both factors – or the interaction of the two - affect the total amount of help offered. Because he is analyzing two independent variables (gender and income), he used a factorial ANOVA. His results show the main effect of each of the independent variables on the dependent variable (total help) and the interaction effect. The researcher is using a 95% confidence interval which means that he wants to be at least 95% sure that his independent variables affected total help if he rejects the null hypothesis. What is one research hypothesis (there are three possible hypotheses here name them all if you can but naming at least one is required)?
- A researcher wants to see if gender and/or income affect the total amount of help given to a stranger who is sitting on the side of a busy road with a sign asking for help. The independent variables are gender, income, and the interaction of gender and income. The dependent variable is total help. He wants to know if one or both factors – or the interaction of the two - affect the total amount of help offered. Because he is analyzing two independent variables (gender and income), he used a factorial ANOVA. His results show the main effect of each of the independent variables on the dependent variable (total help) and the interaction effect. The researcher is using a 95% confidence interval which means that he wants to be at least 95% sure that his independent variables affected total help if he rejects the null hypothesis. Is there significance for either gender or income?A researcher wants to see if gender and/or income affect the total amount of help given to a stranger who is sitting on the side of a busy road with a sign asking for help. The independent variables are gender, income, and the interaction of gender and income. The dependent variable is total help. He wants to know if one or both factors – or the interaction of the two - affect the total amount of help offered. Because he is analyzing two independent variables (gender and income), he used a factorial ANOVA. His results show the main effect of each of the independent variables on the dependent variable (total help) and the interaction effect. The researcher is using a 95% confidence interval which means that he wants to be at least 95% sure that his independent variables affected total help if he rejects the null hypothesis. Is there significance for the interaction of gender and income?A researcher wants to see if gender and/or income affect the total amount of help given to a stranger who is sitting on the side of a busy road with a sign asking for help. The independent variables are gender, income, and the interaction of gender and income. The dependent variable is total help. He wants to know if one or both factors – or the interaction of the two - affect the total amount of help offered. Because he is analyzing two independent variables (gender and income), he used a factorial ANOVA. His results show the main effect of each of the independent variables on the dependent variable (total help) and the interaction effect. The researcher is using a 95% confidence interval which means that he wants to be at least 95% sure that his independent variables affected total help if he rejects the null hypothesis. What is the null hypothesis?
- A researcher wants to see if gender and/or income affect the total amount of help given to a stranger who is sitting on the side of a busy road with a sign asking for help. The independent variables are gender, income, and the interaction of gender and income. The dependent variable is total help. He wants to know if one or both factors – or the interaction of the two - affect the total amount of help offered. Because he is analyzing two independent variables (gender and income), he used a factorial ANOVA. His results show the main effect of each of the independent variables on the dependent variable (total help) and the interaction effect. The researcher is using a 95% confidence interval which means that he wants to be at least 95% sure that his independent variables affected total help if he rejects the null hypothesis. What do the results of this study mean to you?A researcher wants to see if gender and/or income affect the total amount of help given to a stranger who is sitting on the side of a busy road with a sign asking for help. The independent variables are gender, income, and the interaction of gender and income. The dependent variable is total help. He wants to know if one or both factors – or the interaction of the two - affect the total amount of help offered. Because he is analyzing two independent variables (gender and income), he used a factorial ANOVA. His results show the main effect of each of the independent variables on the dependent variable (total help) and the interaction effect. The researcher is using a 95% confidence interval which means that he wants to be at least 95% sure that his independent variables affected total help if he rejects the null hypothesis. What is one research hypothesis (there are three possible hypotheses here – name them all if you can.Fingerprint analysis and blood grouping are features that do not change through the lifetime of an individual. Fingerprint features appear early in the development of a fetus, and blood types are determined by genetics. Therefore, each is considered an effective tool for identification of individuals. These characteristics are also of interest in the discipline of biological anthropology—a scientific discipline concerned with the biological and behavioral aspects of human beings. The relationship between these characteristics was the subject of a study conducted by biological anthropologists with a simple random sample of male students from a certain region with a large student population. Fingerprint patterns are generally classified as loops, whorls, and arches. The four principal blood types are designated as A, B, AB, and O. The table shows the distribution of fingerprint patterns and blood types for the sample. Expected counts are listed in parentheses. The anthropologists…
- Fingerprint analysis and blood grouping are features that do not change through the lifetime of an individual. Fingerprint features appear early in the development of a fetus, and blood types are determined by genetics. Therefore, each is considered an effective tool for identification of individuals. These characteristics are also of interest in the discipline of biological anthropology—a scientific discipline concerned with the biological and behavioral aspects of human beings. The relationship between these characteristics was the subject of a study conducted by biological anthropologists with a simple random sample of male students from a certain region with a large student population. Fingerprint patterns are generally classified as loops, whorls, and arches. The four principal blood types are designated as A, B, AB, and O. The table shows the distribution of fingerprint patterns and blood types for the sample. Expected counts are listed in parentheses. The anthropologists…A public health researcher is interested in some factors that influence heart disease. In a survey of 68 randomly selected localities, he gathered data on the percentage of people in each locality who bike to work “Biking”, the percentage of people in each locality who smoke “Smoking”, and the percentage of people in each locality who have heart disease “Heart.Disease”. The researcher wants to find which explanatory variable will be a better predictor of the response variable, “Heart.Disease”. Investigate the relationship between the explanatory variables and response variable to help the researcher find the better predictor. 1) Interpret the scatterplot of “Biking” and “Heart.Disease” using trend, strength, and shape (form) in one complete sentence. 2) Interpret the scatterplot of “Smoking” and “Heart.Disease” using trend, strength, and shape (form) in one complete sentenceA public health researcher is interested in some factors that influence heart disease. In a survey of 68 randomly selected localities, he gathered data on the percentage of people in each locality who bike to work “Biking”, the percentage of people in each locality who smoke “Smoking”, and the percentage of people in each locality who have heart disease “Heart.Disease”. The researcher wants to find which explanatory variable will be a better predictor of the response variable, “Heart.Disease”. Investigate the relationship between the explanatory variables and response variable to help the researcher find the better predictor. The dataset is called “Heart Disease.” Simple linear regression results: Dependent Variable: Heart. DiseaseIndependent Variable: BikingHeart. Disease = 18.115809 - 0.20845321 BikingSample size: 68R (correlation coefficient) = -0.94616452R-sq = 0.8952273Estimate of error standard deviation: 1.5273175 1) Which of the two explanatory variables would be the better…
