The following table shows a company's annual revenue (in billions of dollars) for 2009 to 2014. Period (t) Revenue ($ billions) Year 2009 2010 2011 2012 2013 2014 80- 70- 1 (a) Construct a time series plot. 0 2 1 5 6 2 DENK 5 6 3 23.8 Period 29.2 37.9 50.2 59.7 66.8 ⓇO 0 1 2 Period 1 2 Period 5 6 no 20 10- 0 1 2 3 Period. Ⓡ
The following table shows a company's annual revenue (in billions of dollars) for 2009 to 2014. Period (t) Revenue ($ billions) Year 2009 2010 2011 2012 2013 2014 80- 70- 1 (a) Construct a time series plot. 0 2 1 5 6 2 DENK 5 6 3 23.8 Period 29.2 37.9 50.2 59.7 66.8 ⓇO 0 1 2 Period 1 2 Period 5 6 no 20 10- 0 1 2 3 Period. Ⓡ

MATLAB: An Introduction with Applications
6th Edition
ISBN:9781119256830
Author:Amos Gilat
Publisher:Amos Gilat
Chapter1: Starting With Matlab
Section: Chapter Questions
Problem 1P

Related questions
Question
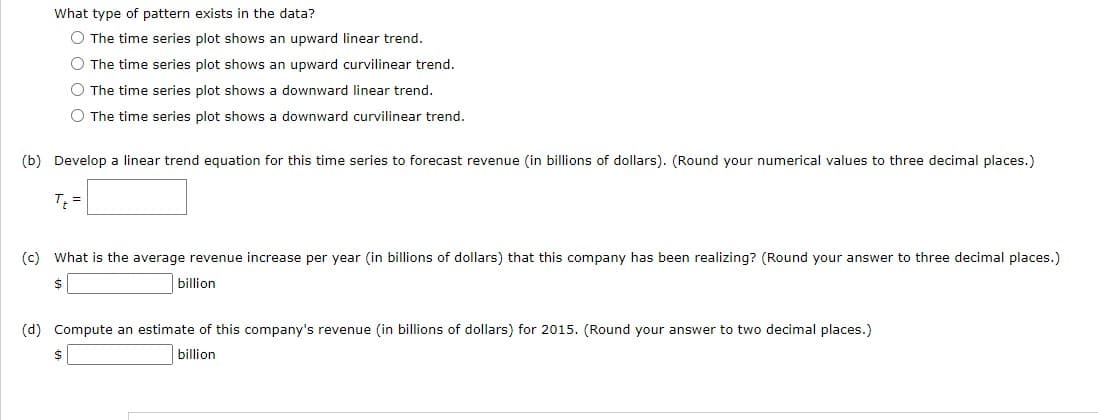
Transcribed Image Text:What type of pattern exists in the data?
O The time series plot shows an upward linear trend.
O The time series plot shows an upward curvilinear trend.
O The time series plot shows a downward linear trend.
O The time series plot shows a downward curvilinear trend.
(b) Develop a linear trend equation for this time series to forecast revenue (in billions of dollars). (Round your numerical values to three decimal places.)
T₁ =
(c) What is the average revenue increase per year (in billions of dollars) that this company has been realizing? (Round your answer to three decimal places.)
$
billion
(d) Compute an estimate of this company's revenue (in billions of dollars) for 2015. (Round your answer to two decimal places.)
billion
$
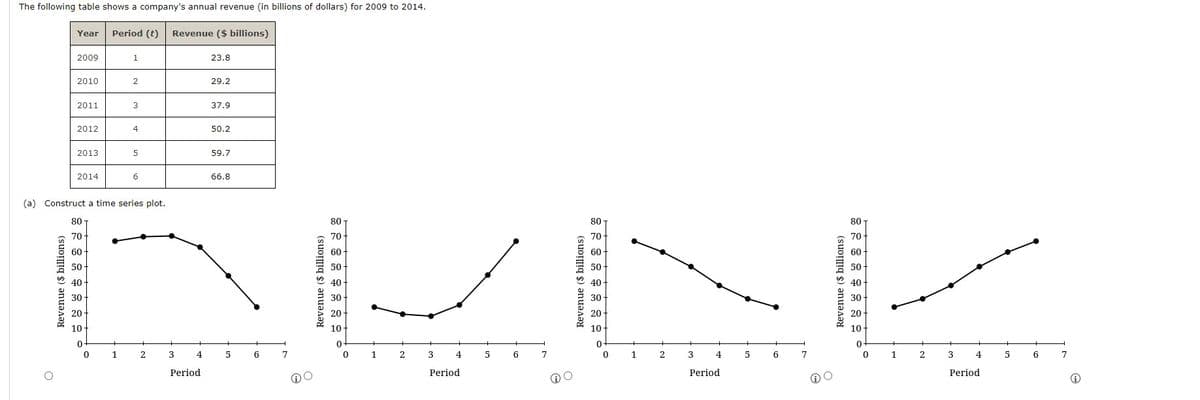
Transcribed Image Text:The following table shows a company's annual revenue (in billions of dollars) for 2009 to 2014.
Year Period (t) Revenue ($ billions)
2009
Revenue ($ billions)
2010
2011
2012
2013
2014
80
70
60
50
40
30
10
0
1
0
2
(a) Construct a time series plot.
3
4
5
6
+
1 2
3
4
Period
23.8
29.2
37.9
50.2
59.7
66.8
4
5 6 7
Revenue ($ billions)
80
70
60
50
40
30
20
10
0-
0
1
2
3
4
Period
4
5 6 7
Revenue ($ billions)
80
70
60
50
40
30
20
10
0
0
+
1
+
2
3
4
Period
+
5
6 7
80
70
60
50
1
40
30
20
10
Revenue ($ billions)
0
0
1
+
2
+
3
4
Period
5
6 7
Expert Solution
This question has been solved!
Explore an expertly crafted, step-by-step solution for a thorough understanding of key concepts.

Step by step
Solved in 2 steps with 2 images

Recommended textbooks for you
MATLAB: An Introduction with Applications
Statistics
ISBN:
9781119256830
Author:
Amos Gilat
Publisher:
John Wiley & Sons Inc

Probability and Statistics for Engineering and th…
Statistics
ISBN:
9781305251809
Author:
Jay L. Devore
Publisher:
Cengage Learning

Statistics for The Behavioral Sciences (MindTap C…
Statistics
ISBN:
9781305504912
Author:
Frederick J Gravetter, Larry B. Wallnau
Publisher:
Cengage Learning
MATLAB: An Introduction with Applications
Statistics
ISBN:
9781119256830
Author:
Amos Gilat
Publisher:
John Wiley & Sons Inc
Probability and Statistics for Engineering and th…
Statistics
ISBN:
9781305251809
Author:
Jay L. Devore
Publisher:
Cengage Learning
Statistics for The Behavioral Sciences (MindTap C…
Statistics
ISBN:
9781305504912
Author:
Frederick J Gravetter, Larry B. Wallnau
Publisher:
Cengage Learning

Elementary Statistics: Picturing the World (7th E…
Statistics
ISBN:
9780134683416
Author:
Ron Larson, Betsy Farber
Publisher:
PEARSON

The Basic Practice of Statistics
Statistics
ISBN:
9781319042578
Author:
David S. Moore, William I. Notz, Michael A. Fligner
Publisher:
W. H. Freeman

Introduction to the Practice of Statistics
Statistics
ISBN:
9781319013387
Author:
David S. Moore, George P. McCabe, Bruce A. Craig
Publisher:
W. H. Freeman