Directions: Write the word TRUE if the statement is correct and FALSE if the statement is incorrect. 1. When the means are different and the standard deviations are also different (u14 u2 ; 01 # o2 ), the curves are centered at different points and vary in shapes.
Directions: Write the word TRUE if the statement is correct and FALSE if the statement is incorrect. 1. When the means are different and the standard deviations are also different (u14 u2 ; 01 # o2 ), the curves are centered at different points and vary in shapes.

MATLAB: An Introduction with Applications
6th Edition
ISBN:9781119256830
Author:Amos Gilat
Publisher:Amos Gilat
Chapter1: Starting With Matlab
Section: Chapter Questions
Problem 1P

Related questions
Question
Transcribed Image Text:IRUE or FAL SE
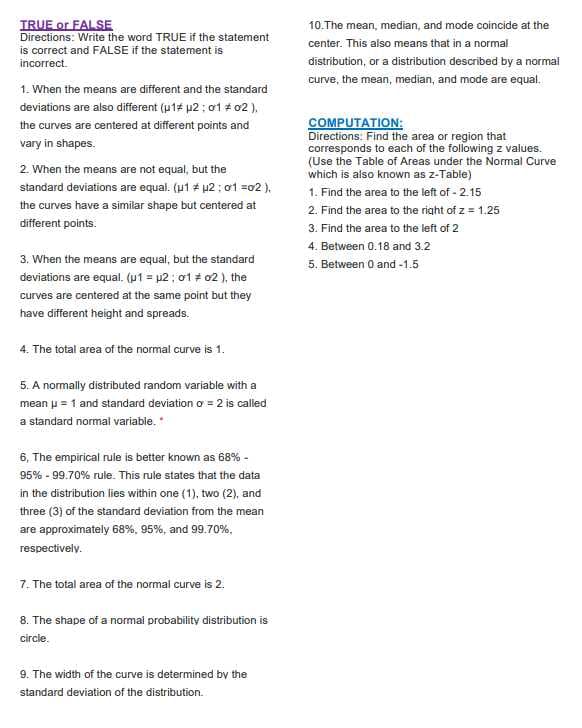
Directions: Write the word TRUE if the statement
is correct and FALSE if the statement is
10.The mean, median, and mode coincide at the
center. This also means that in a normal
incorrect.
distribution, or a distribution described by a normal
curve, the mean, median, and mode are equal.
1. When the means are different and the standard
deviations are also different (u1# u2 ; 01 # 02 ),
COMPUTATION:
Directions: Find the area or region that
corresponds to each of the following z values.
(Use the Table of Areas under the Normal Curve
which is also known as z-Tabie)
the curves are centered at different points and
vary in shapes.
2. When the means are not equal, but the
standard deviations are equal. (u1 # u2 : o1 =02 ),
1. Find the area to the left of - 2.15
the curves have a similar shape but centered at
2. Find the area to the right of z = 1.25
different points.
3. Find the area to the left of 2
4. Between 0.18 and 3.2
3. When the means are equal, but the standard
5. Between 0 and -1.5
deviations are equal. (p1 = u2 ; 01 # 02 ), the
curves are centered at the same point but they
have different height and spreads.
4. The total area of the normal curve is 1.
5. A normally distributed random variable with a
mean u = 1 and standard deviation o = 2 is called
a standard normal variable.
6, The empirical rule is better known as 68% -
95% - 99.70% rule. This rule states that the data
in the distribution lies within one (1), two (2), and
three (3) of the standard deviation from the mean
are approximately 68%, 95%, and 99.70%,
respectively.
7. The total area of the normal curve is 2.
8. The shape of a normal probability distribution is
circie.
9. The width of the curve is determined by the
standard deviation of the distribution.
Expert Solution
This question has been solved!
Explore an expertly crafted, step-by-step solution for a thorough understanding of key concepts.

This is a popular solution!

Trending now
This is a popular solution!

Step by step
Solved in 2 steps

Recommended textbooks for you
MATLAB: An Introduction with Applications
Statistics
ISBN:
9781119256830
Author:
Amos Gilat
Publisher:
John Wiley & Sons Inc

Probability and Statistics for Engineering and th…
Statistics
ISBN:
9781305251809
Author:
Jay L. Devore
Publisher:
Cengage Learning

Statistics for The Behavioral Sciences (MindTap C…
Statistics
ISBN:
9781305504912
Author:
Frederick J Gravetter, Larry B. Wallnau
Publisher:
Cengage Learning
MATLAB: An Introduction with Applications
Statistics
ISBN:
9781119256830
Author:
Amos Gilat
Publisher:
John Wiley & Sons Inc
Probability and Statistics for Engineering and th…
Statistics
ISBN:
9781305251809
Author:
Jay L. Devore
Publisher:
Cengage Learning
Statistics for The Behavioral Sciences (MindTap C…
Statistics
ISBN:
9781305504912
Author:
Frederick J Gravetter, Larry B. Wallnau
Publisher:
Cengage Learning

Elementary Statistics: Picturing the World (7th E…
Statistics
ISBN:
9780134683416
Author:
Ron Larson, Betsy Farber
Publisher:
PEARSON

The Basic Practice of Statistics
Statistics
ISBN:
9781319042578
Author:
David S. Moore, William I. Notz, Michael A. Fligner
Publisher:
W. H. Freeman

Introduction to the Practice of Statistics
Statistics
ISBN:
9781319013387
Author:
David S. Moore, George P. McCabe, Bruce A. Craig
Publisher:
W. H. Freeman