Do the Complete REGRESSION ANALYSIS using the data given in table A ( Do the analysis using suitable formula and using r-scrits( RStudio) a) Draw the scatter plot b) Compute the value of the correlation coefficient (r) c) Determine the regression line equation d) predict y' for Driver's age (x)= 50 Table A Driver's Age(x) Number of accidents y 60 1 55 3 45 1 18 6 21 5 35 3 66 1 20 7 63 48 2
Do the Complete REGRESSION ANALYSIS using the data given in table A ( Do the analysis using suitable formula and using r-scrits( RStudio) a) Draw the scatter plot b) Compute the value of the correlation coefficient (r) c) Determine the regression line equation d) predict y' for Driver's age (x)= 50 Table A Driver's Age(x) Number of accidents y 60 1 55 3 45 1 18 6 21 5 35 3 66 1 20 7 63 48 2

Glencoe Algebra 1, Student Edition, 9780079039897, 0079039898, 2018
18th Edition
ISBN:9780079039897
Author:Carter
Publisher:Carter
Chapter4: Equations Of Linear Functions
Section4.6: Regression And Median-fit Lines
Problem 5PPS

Related questions
Question
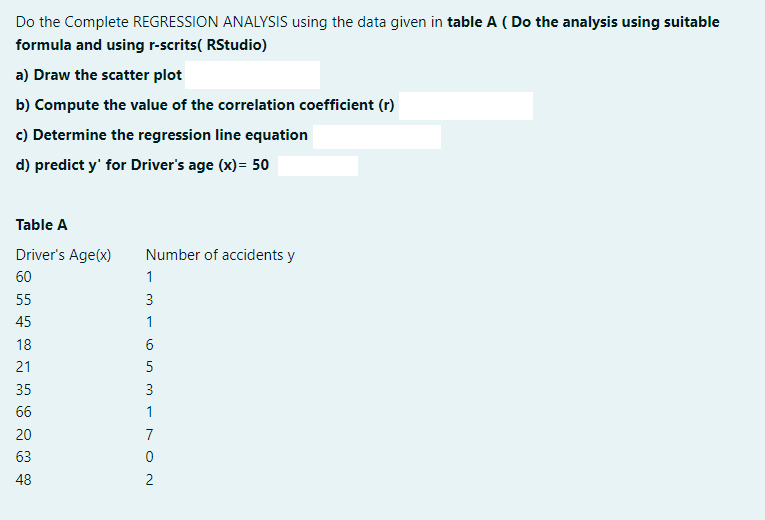
Transcribed Image Text:Do the Complete REGRESSION ANALYSIS using the data given in table A ( Do the analysis using suitable
formula and using r-scrits( RStudio)
a) Draw the scatter plot
b) Compute the value of the correlation coefficient (r)
c) Determine the regression line equation
d) predict y' for Driver's age (x)= 50
Table A
Driver's Age(x)
Number of accidents y
60
1
55
3
45
1
18
21
5
35
3
66
1
20
7
63
48
2
Expert Solution
This question has been solved!
Explore an expertly crafted, step-by-step solution for a thorough understanding of key concepts.

Step by step
Solved in 4 steps

Recommended textbooks for you
Glencoe Algebra 1, Student Edition, 9780079039897…
Algebra
ISBN:
9780079039897
Author:
Carter
Publisher:
McGraw Hill

Algebra & Trigonometry with Analytic Geometry
Algebra
ISBN:
9781133382119
Author:
Swokowski
Publisher:
Cengage

Big Ideas Math A Bridge To Success Algebra 1: Stu…
Algebra
ISBN:
9781680331141
Author:
HOUGHTON MIFFLIN HARCOURT
Publisher:
Houghton Mifflin Harcourt
Glencoe Algebra 1, Student Edition, 9780079039897…
Algebra
ISBN:
9780079039897
Author:
Carter
Publisher:
McGraw Hill
Algebra & Trigonometry with Analytic Geometry
Algebra
ISBN:
9781133382119
Author:
Swokowski
Publisher:
Cengage
Big Ideas Math A Bridge To Success Algebra 1: Stu…
Algebra
ISBN:
9781680331141
Author:
HOUGHTON MIFFLIN HARCOURT
Publisher:
Houghton Mifflin Harcourt