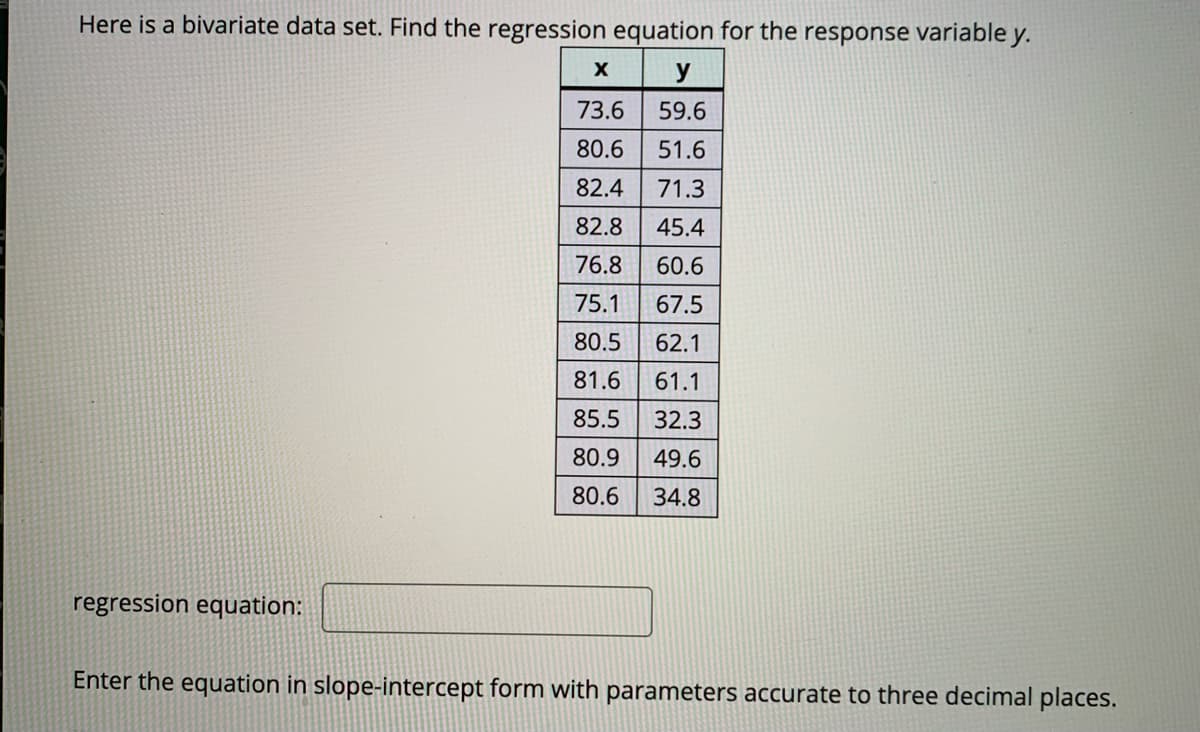
Here is a bivariate data set. Find the regression equation for the response variable y. y 73.6 59.6 80.6 51.6 82.4 71.3 82.8 45.4 76.8 60.6 75.1 67.5 80.5 62.1 81.6 61.1 85.5 32.3 80.9 49.6 80.6 34.8 regression equation: Enter the equation in slope-intercept form with parameters accurate to three decimal places.


Q: Run a regression analysis on the following bivariate set of data with y as the response variable.…
A: It is an important part of statistics. It is widely used.
Q: x y 23 91.3 28.4 79.4 28.6 72.6 41.3 56.9 19.1 97 29.9 71.9 29.5 77.9 36.6 65.4 33.3 67.8 24.9 78.8…
A:
Q: Run a regression analysis on the following bivariate set of data with y as the response variable. x…
A:
Q: 80.2
A:
Q: a regression analysis on the following bivariate set of data with y as the response variable. X y…
A:
Q: Here is a scatter plot for a set of paired data. Which of the following options is the best estimate…
A: From the Scatter Plot it is clearly get to know there is good linear relationship between the both…
Q: Run a regression analysis on the following bivariate set of data with y as the response variable. x…
A: Solution Given data is x y 42.1 45.1 47.5 -9 31.6 39.8 41.5 16.3 19.5 87.4 37.2 31.7 47.1 19.7 66.6…
Q: Run a regression analysis on the following data set with y as the response variable. y 76 49.6 81.8…
A: Given
Q: Run a regression analysis on the following bivariate set of data with y as the response variable. x…
A: Solution: x y (x-x) (x-x)2 (y-y) (y-y)2 (x-x)(y-y) 21.5 -5.9 -40.3 1624.09 -47.2 2227.84…
Q: Run a regression analysis on the following bivariate set of data with y as the response variable. x…
A:
Q: Listed below are paired data consisting of movie budget amounts and the amounts that the movies…
A: Given data, X Y X*Y X*X 42 109 4578 1764 23 20 460 529 116 95 11020 13456 71 70 4970 5041…
Q: Run a regression analysis on the following bivariate set of data with y as the response variable.…
A:
Q: Run a regression analysis on the following bivariate set of data with y as the response variable. y…
A:
Q: Run a regression analysis on the following bivariate set of data with y as the response variable. x…
A: Correlation quantifies the strength of relationship between 2 variables. The value of correlation…
Q: Listed below are paired data consisting of movie budget amounts and the amounts that the movies…
A:
Q: Run a regression analysis on the following data set with y as the response variable. X y 67 | 37.6…
A: The data set is given by x y 67 37.6 69.9 37.4 54.9 33.5…
Q: Run a regression analysis on the following bivariate set of data with y as the response variable. x…
A: Solution-: Given: α=0.05 We verify that the correlation is significant at an α=0.05. If the…
Q: Listed Below are amounts of bills for dinner and the amounts of tips thet were left. is there…
A: A) The scatterplot of the data can be obtained using excel steps as follow: Enter the data in to…
Q: The paired data below consist of the test scores of 6 randomly selected students and the number of…
A: The correlation coefficient gives the strength of the relationship between two variables. Consider…
Q: Run a regression analysis on the following bivariate set of data with y as the response variable. 42…
A: The data inserted in EXCEL is defined below:
Q: Run a regression analysis on the following bivariate set of data with y as the response variable. x…
A: The independent variable is x. The dependent variable is y. We have to predict the explanatory…
Q: Run a regression analysis on the following bivariate set of data with y as the response variable. x…
A: The data is given by : x y 37.6 33.4 55.3 73 56 62.7 76.4 76.5 57.7 54.1 58.8 69.8…
Q: Predict what value (on average) for the response variable will be obtained from a value of 63.3 as…
A: from the above data Y=b0+b1xMy=∑Yn=3.77=3.77MX=∑Xn=581.2=581.2
Q: Run a regression analysis on the following bivariate set of data with y as the response variable. x…
A: Since you have posted a question with multiple sub-parts, we will solve first three subpartsfor you.…
Q: Run a regression analysis on the following bivariate set of data with y as the response variable. x…
A: x y 70.2 -67.3 8 115.8 52.6 -8.1 23.4 85.7 61.8 6.6 40.7 23.7 39 86.4 61.5 11.2…
Q: Run a regression analysis on the following bivariate set of data with y as the response variable. y…
A: The Correlation coefficient is denoted with 'r' and it determines the direction and strength of…
Q: Run a regression analysis on the following bivariate set of data with y as the response variable. x…
A:
Q: Run a regression analysis on the following bivariate set of data with y as the response variable. X…
A: Regression analysis can be performed using Excel. Enter the data in the spreadsheet Go to DATA >…
Q: Run a regression analysis on the following data set with y as the response variable. X y 39.5 12.5…
A: Given: The provided data is: x 39.5 35.1 36.8 11.2 21.5 34.1 45.2 41.5 54 y 12.5 18.5 32.6…
Q: x y 29.3 65.7 36.8 90 61.2 89 60.4 95.4 30.1 62.2 28.6 49.3 53.6 83.3 47.8 93.5 32.8 80.5 28.2 78…
A:
Q: Run a regression analysis on the following bivariate set of data with y as the response variable. x…
A: Correlation coefficient is given by, H0: the correlation is not significant. H1: the correlation…
Q: Run a regression analysis on the following bivariate set of data with y as the response variable. y…
A: In this case, x is the independent variable, and y is the dependent variable.
Q: Run a regression analysis on the following bivariate set of data with y as the response variable. x…
A: Let us define the independent and dependent variable. Let , x be the independent variable and…
Q: Run a regression analysis on the following bivariate set of data with y as the response variable. x…
A: Introduction: The response variable here is y, and the explanatory variable is x.
Q: Verify that the correlation is significant at an α=0.05α=0.05. If the correlation is indeed…
A: Given: The number of pairs, n=11 x y 40.5 -15.7 30.8 -40 38.8 35.8 57.2 37.5 48.2 -8.2…
Q: Using the data from the prior correlation question (altruism and health), Find the regression line…
A: Regression equation is used to predict the value of response variables using the explanatory…
Q: Run a regression analysis on the following bivariate set of data with y as the response variable. х…
A: Introduction: We have solved the problem using Excel. First, we have entered the in the two columns,…
Q: Run a regression analysis on the following bivariate set of data with y as the response variable. x…
A: Solution-: We verify that the correlation is significant at an α=0.05. If the correlation is indeed…
Q: Run a regression analysis on the following bivariate set of data with y as the response variable. x…
A: Note: Hey there! Thank you for the question. As you have posted a question with multiple sub-parts,…
Q: A particular professor has noticed that the number of people, P who complain about his attitude is…
A: Note: Since, we only answer up to 3 sub-parts, we'll answer the first 3 (that is a, b, d). Please…
Q: Run a regression analysis on the following bivariate set of data with y as the response variable.…
A:
Q: Run a regression analysis on the following bivariate set of data with y as the response variable. x…
A: Solution-: Predict what value (on average) for the response variable will be obtained from a value…
Q: Here is a bivariate data set in which you believe y to be the response variable. x y 57.3 72.6 45.4…
A: Steps to construct scatter plot in Excel: Enter the data for x and y in Excel sheet>Select the…
Q: Run a regression analysis on the following bivariate set of data with y as the response variable. x…
A: In this case, the variable y (dependent variable) is predicted on the basis of x (independent…
Q: Run a regression analysis on the following bivariate set of data with y as the response variable.…
A: In this case x is the independent variable and y is the dependent variable. Enter the data in Excel.
Q: Find the correlation coefficient and report it accurate to three decimal places. r = What…
A: Since you have posted a question with multiple sub-parts, we will solve first three sub-parts for…
Q: What is the predicted response value? (Report answer accurate to one decimal place.) y =…
A: Given : X Y 43.8 54.1 41.3 51.2 35.3 60.1 48.1 44.9 42.8 51.8 44.7 50.8 39.4…
Q: Run a regression analysis on the following bivariate set of data with y as the response variable. x…
A: Thank you for posting the question. As your question has more than 3 parts, as per the policy, we…
Q: Run a regression analysis on the following bivariate set of data with y as the response variable. x…
A: Given: the following bivariate set of data Enter the value in excel sheet
Q: Run a regression analysis on the following bivariate set of data with y as the response variable. y…
A: Given that

Step by step
Solved in 2 steps

- Olympic Pole Vault The graph in Figure 7 indicates that in recent years the winning Olympic men’s pole vault height has fallen below the value predicted by the regression line in Example 2. This might have occurred because when the pole vault was a new event there was much room for improvement in vaulters’ performances, whereas now even the best training can produce only incremental advances. Let’s see whether concentrating on more recent results gives a better predictor of future records. (a) Use the data in Table 2 (page 176) to complete the table of winning pole vault heights shown in the margin. (Note that we are using x=0 to correspond to the year 1972, where this restricted data set begins.) (b) Find the regression line for the data in part ‚(a). (c) Plot the data and the regression line on the same axes. Does the regression line seem to provide a good model for the data? (d) What does the regression line predict as the winning pole vault height for the 2012 Olympics? Compare this predicted value to the actual 2012 winning height of 5.97 m, as described on page 177. Has this new regression line provided a better prediction than the line in Example 2?Here is a bivariate data set. Find the regression equation for the response variable y. x y 36.6 56.9 34.9 51.8 24.2 65.9 36.3 61 23.6 65.6 40.3 63.3 8.1 63.3 39.9 52.2 38.6 61.4 43.1 51.2 regression equation: ? Enter the equation in slope-intercept form with parameters accurate to three decimal places.A group of students measure the length and width of a random sample of beans. They are interested in investigating the relationship between the length and width. Their summary statistics are displayed in the table below. All units, if applicable, are millimeters. Mean width: 7.555 Stdev width: 0.914 Mean height: 12.686 Stdev height: 1.634 Correlation coefficient: 0.8203 d) If the students are interested in using the height of the beans to predict the width, calculate the slope of this new regression equation. e) Write the equation of the best-fit line that can be used to predict bean widths. Use x to represent height and y to represent width.
- A study of the amount of rainfall and the quantity of air pollution removed produced the following data shown in table below: Daily Rainfall x (0.01 cm) Particulate Removed y (μg/m3) 7 126 7.9 129.3 7.5 125.3 9.2 120.2 10.8 116.7 5.8 119.2 5.6 138.7 2.7 147.5 9.2 110.3 Compute and interpret the coefficient of determination, and coefficient of correlation for the given data. What will be the regression equation, when swapped depended and independent variableGiven the partial results from a linear regression model below, a sample size of 504, and ɑ=0.05, What is the F-Statistic for the overall model? Is it statistically significant? What is the R2 for the regression model above?In a linear regression model, calculate the slope of the line, b1, when the correlation coefficient is r = -0.37, and the standard deviations of the predictor variable equals sx = 0.552 and the standard deviation of the response variable equals sy = 0.552. Only round your final answer to 2 decimal places.
- Run a regression analysis on the following bivariate set of data with y as the response variable. x y 42.1 45.1 47.5 -9 31.6 39.8 41.5 16.3 19.5 87.4 37.2 31.7 47.1 19.7 66.6 -55.3 41.5 15.2 43.6 6.4 30.6 33 15.9 75.1 Find the correlation coefficient and report it accurate to three decimal places.r = __?__What proportion of the variation in y can be explained by the variation in the values of x? Report answer as a percentage accurate to one decimal place. (If the answer is 0.84471, then it would be 84.5%...you would enter 84.5 without the percent symbol.)r² = __?__ %Working as a professor, I may want to try and predict success on a final exam by student success on exam 1 and see whether or not there is a relationship between those. I gather data from a set of students and obtain their first exam score and their final exam score. Using the following data, find the Pearson’s r correlation coefficient, produce a linear regression equation, and describe the associated R2 value. First exam score (X) Final exam score (Y) 95 100 90 92 95 90 85 90 85 85 80 75 65 75 60 50 70 82 90 95 80 100 90 90 75 60 75 80 Pearson’s r = ______________ Is the r significant? _______________ Linear regression equation: ____________________Working as a professor, I may want to try and predict success on a final exam by student success on exam 1 and see whether or not there is a relationship between those. I gather data from a set of students and obtain their first exam score and their final exam score. Using the following data, find the Pearson’s r correlation coefficient, produce a linear regression equation, and describe the associated R2 value. First exam score (X) Final exam score (Y) 95 100 90 92 95 90 85 90 85 85 80 75 65 75 60 50 70 82 90 95 80 100 90 90 75 60 75 80 R2 = ____________________ What does R2 in this example mean? ____________________________________________ What would the final exam score be for someone who scored a 75 on the first exam? _______________ What would the final exam score be for someone who scored a 90 on the first exam? _______________
- If the standard error of the estimate for a regression model fitted to a large number of paired observations is 1.75, approximately 95% of the residuals would lie within ______. −3.50 and +3.50 −1.75 and +1.75 −0.95 and +0.95 −0.68 and +0.68 −0.97 and +0.97The marketing manager of a supermarket chain would like to determine the effect of shelf spaceon the sales of pet food. A random sample of 10 stores was selected, and the results are presentedbelow. Store shelf space in cm weekly sales in thousand pesos 1 45 18 2 45 21 3 75 15 4 80 18 5 95 23 6 100 26 7 135 22 8 140 27 9 185 25 10 190 28 d. Using the estimated simple linear regression equation Y=15.6414+0.0611X, estimate the weekly sales when theshelf space is 230cm? 250cm? e. Compute the coefficient of determination and interpret its value.In the above plot, a rejection of the null hypothesis that the population regression slope is equal to 0 implies: a) the correlation coefficient in the population is likely equal to 0 b) the correlation coefficient in the population is likely unequal to 0 c) the standard deviation of height is likely very large d) the standard deviation of weightis likely very small e) the correlation coefficient must be close to 1.0 f) a and c g) b and e h) b, d and e
