Do women feel differently from men when it comes to tax rates? One question on a survey of randomly selected aduts asked, "What percent of income do you believe individuals should pay in income tax?" Complete parts a) through c). Click the icon to view the survey results. a) Draw side-by-side boxplots of tax rates by gender. Choose the corect graph below. M OA 16 40 OD. Does there appear to be a difference in the income tax rates between genders? A. Yes because the income tax rate for females appears to have a higher median than the income tax rate for males. OB. Yes because the income tax rate for males appears to have a higher median than the income tax rate for females. OC. No because the income tax rate is about the same for males and females. OD. No but the maximum income tax rate for males is higher than the maximum income tax rate for females. b) Explain why a hypothesis test may be used to test whether the mean tax rates for the two genders differ Select all that apply MA Each sample size is smal relative to the size of ts population. Ma. Each sample is a simple random sample. Each sample size is large. Each sample is obtained independently of the other DE Each sample has the same sample size. e) Test whether the mean tax rate for females differs from that of males at the a0.01 level of significance. Delermine the nul and alternative hypotheses for this test. Let represent the mean income tax rate for males and let y represent the mean income tax rate for females. My: u - w versus H, M Find to. the test statistic for this hypothesis test. 6- 0.87 (Round to two decimal places as needed.)
Do women feel differently from men when it comes to tax rates? One question on a survey of randomly selected aduts asked, "What percent of income do you believe individuals should pay in income tax?" Complete parts a) through c). Click the icon to view the survey results. a) Draw side-by-side boxplots of tax rates by gender. Choose the corect graph below. M OA 16 40 OD. Does there appear to be a difference in the income tax rates between genders? A. Yes because the income tax rate for females appears to have a higher median than the income tax rate for males. OB. Yes because the income tax rate for males appears to have a higher median than the income tax rate for females. OC. No because the income tax rate is about the same for males and females. OD. No but the maximum income tax rate for males is higher than the maximum income tax rate for females. b) Explain why a hypothesis test may be used to test whether the mean tax rates for the two genders differ Select all that apply MA Each sample size is smal relative to the size of ts population. Ma. Each sample is a simple random sample. Each sample size is large. Each sample is obtained independently of the other DE Each sample has the same sample size. e) Test whether the mean tax rate for females differs from that of males at the a0.01 level of significance. Delermine the nul and alternative hypotheses for this test. Let represent the mean income tax rate for males and let y represent the mean income tax rate for females. My: u - w versus H, M Find to. the test statistic for this hypothesis test. 6- 0.87 (Round to two decimal places as needed.)

Glencoe Algebra 1, Student Edition, 9780079039897, 0079039898, 2018
18th Edition
ISBN:9780079039897
Author:Carter
Publisher:Carter
Chapter10: Statistics
Section10.1: Measures Of Center
Problem 4GP

Related questions
Question
Only need the last question thank you! Apparently what I already wrote in is incorrect.
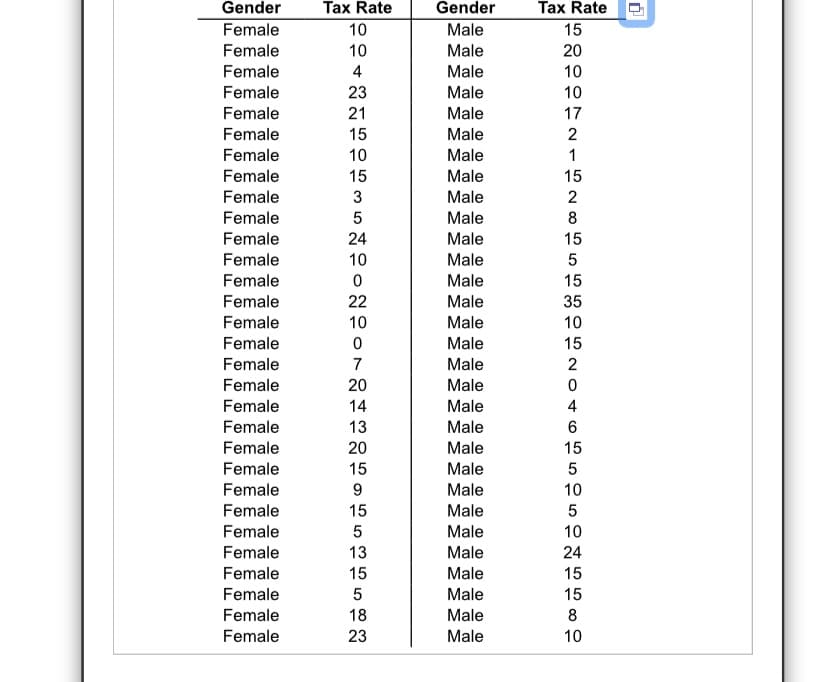
Transcribed Image Text:Gender
Tax Rate
Gender
Tax Rate
Female
10
Male
15
Female
10
Male
20
Female
4
Male
10
Female
23
Male
10
Female
21
Male
17
Female
15
Male
Female
10
Male
1
Male
15
2
Female
15
Female
3
Male
Female
Male
Female
24
Male
15
Female
10
Male
Female
Male
15
Female
22
Male
35
Female
10
Male
10
Female
Male
15
Female
7
Male
2
Female
20
Male
Female
14
Male
4
Female
13
Male
Female
20
Male
15
Female
15
Male
5
Female
9
Male
10
Female
15
Male
Female
5
Male
10
Female
13
Male
24
Female
15
Male
15
Female
Male
15
Female
18
Male
8
Female
23
Male
10
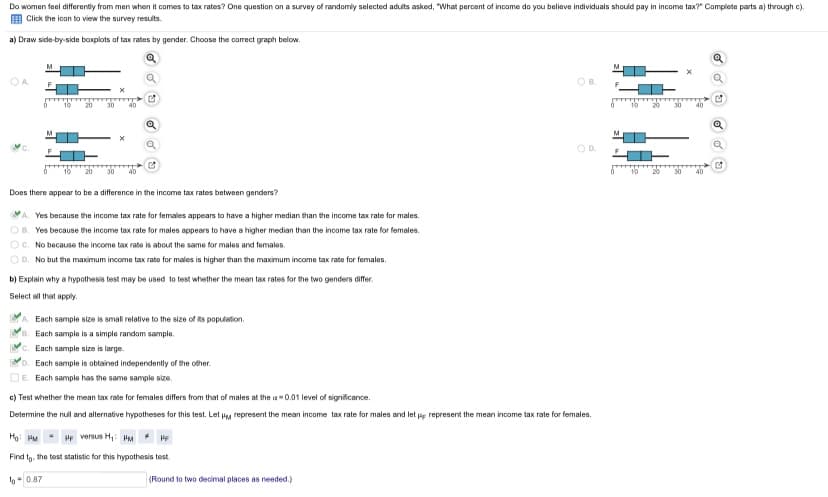
Transcribed Image Text:Do women feel differently from men when it comes to tax rates? One question on a survey of randomly selected adults asked, "What percent of income do you believe individuals should pay in income tax?" Complete parts a) through c).
E Click the icon to view the survey results.
a) Draw side-by-side boxplots of tax rates by gender. Choose the correct graph below.
M
OA.
OB.
10
20
30
10
40
M
OD.
10
20
30
40
10
20
30
40
Does there appear to be a difference in the income tax rates between genders?
A. Yes because the income tax rate for females appears to have a higher median than the income tax rate for males.
OB. Yes because the income tax rate for males appears to have a higher median than the income tax rate for females.
OC. No because the income tax rate is about the same for males and females.
OD. No but the maximum income tax rate for males is higher than the maximum income tax rate for females.
b) Explain why a hypothesis test may be used to test whether the mean tax rates for the two genders differ.
Select all that apply.
A. Each sample size is smal relative to the size of its population.
B. Each sample is a simple random sample.
'c. Each sample size is large.
D. Each sample is obtained independently of the other.
DE Each sample has the same sample size.
c) Test whether the mean tax rate for females differs from that of males at the a -0.01 level of significance.
Determine the null and alternative hypotheses for this test. Let Pa represent the mean income tax rate for males and let pe represent the mean income tax rate for females.
Hg: Hu - HF versus H,: HM * HF
Find to. the test statistic for this hypothesis test.
to-0.87
(Round to two decimal places as needed.)
Expert Solution
This question has been solved!
Explore an expertly crafted, step-by-step solution for a thorough understanding of key concepts.

This is a popular solution!

Trending now
This is a popular solution!

Step by step
Solved in 2 steps

Knowledge Booster


Learn more about
Need a deep-dive on the concept behind this application? Look no further. Learn more about this topic, statistics and related others by exploring similar questions and additional content below.Recommended textbooks for you
Glencoe Algebra 1, Student Edition, 9780079039897…
Algebra
ISBN:
9780079039897
Author:
Carter
Publisher:
McGraw Hill

Holt Mcdougal Larson Pre-algebra: Student Edition…
Algebra
ISBN:
9780547587776
Author:
HOLT MCDOUGAL
Publisher:
HOLT MCDOUGAL

College Algebra (MindTap Course List)
Algebra
ISBN:
9781305652231
Author:
R. David Gustafson, Jeff Hughes
Publisher:
Cengage Learning
Glencoe Algebra 1, Student Edition, 9780079039897…
Algebra
ISBN:
9780079039897
Author:
Carter
Publisher:
McGraw Hill
Holt Mcdougal Larson Pre-algebra: Student Edition…
Algebra
ISBN:
9780547587776
Author:
HOLT MCDOUGAL
Publisher:
HOLT MCDOUGAL
College Algebra (MindTap Course List)
Algebra
ISBN:
9781305652231
Author:
R. David Gustafson, Jeff Hughes
Publisher:
Cengage Learning

Big Ideas Math A Bridge To Success Algebra 1: Stu…
Algebra
ISBN:
9781680331141
Author:
HOUGHTON MIFFLIN HARCOURT
Publisher:
Houghton Mifflin Harcourt

Linear Algebra: A Modern Introduction
Algebra
ISBN:
9781285463247
Author:
David Poole
Publisher:
Cengage Learning