Does the current study’s results regarding compositional differences using pasteurized veruses. non-pasteurized milk make sense with previous work? please i need the answer from the article
Does the current study’s results regarding compositional differences using pasteurized veruses. non-pasteurized milk make sense with previous work? please i need the answer from the article

Chapter10: Feeds And Feeding
Section: Chapter Questions
Problem 2KA

Related questions

Question
Does the current study’s results regarding compositional differences using pasteurized veruses. non-pasteurized milk make sense with previous work?
please i need the answer from the article
Transcribed Image Text:Table 1 Composition of the pasteurized Gouda cheese samples
Brand and location
pH
aw
A
Under the rind
Core
Inside
B
Under the rind
Core
Inside
C
Under the rind
Core
Core
Inside
D
Under the rind
Core
Lore
Inside
Inside
E
Under the rind
Core
Inside
F
Under the rind
Core
Inside
G
Under the rind
Core
Inside
H
Under the rind
Core
Inside
J
Under the rind
Core
Inside
K
Under the rind
Core
Inside
L
Under the rind
Core
Inside
M
6.37
5.26
5.41
Salazar et al. BMC Microbiology (2018) 18:189
Under the rind
Core
Inside
5.76
5.43
5.44
N
5.75
5.64
5.71
Under the rind
Core
Inside
6.02
5.86
5.85
0
5.97
5.59
5.44
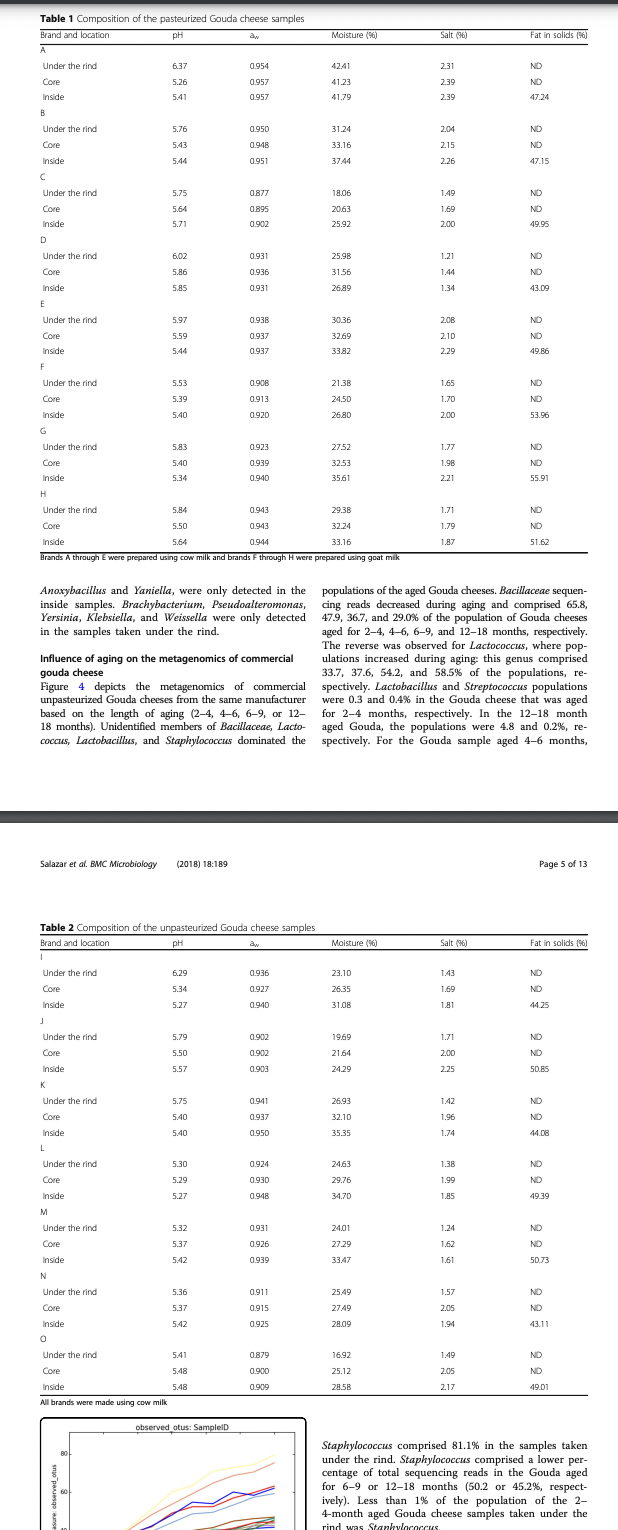
Anoxybacillus and Yaniella, were only detected in the
inside samples. Brachybacterium, Pseudoalteromonas,
Yersinia, Klebsiella, and Weissella were only detected.
in the samples taken under the rind.
Under the rind
Core
Inside
All brands were made using cow milk
5.53
5.39
5.40
Influence of aging on the metagenomics of commercial
gouda cheese
60
5.83
5.40
5.34
Figure 4 depicts the metagenomics of commercial
unpasteurized Gouda cheeses from the same manufacturer
based on the length of aging (2-4, 4-6, 6-9, or 12-
18 months). Unidentified members of Bacillaceae, Lacto-
coccus, Lactobacillus, and Staphylococcus dominated the
Table 2 Composition of the unpasteurized Gouda cheese samples
Brand and location
pH
aw
I
Under the rind
5.84
0.943
Core
5.50
0.943
5.64
0.944
Inside
Brands A through E were prepared using cow milk and brands F through H were prepared using goat milk
6.29
5.34
5.27
5.79
5.50
557
5.75
5.40
5.40
0.954
0.957
0.957
5.30
5.29
5.27
0.950
0.948
0.951
5.32
5.37
5.42
0.877
0.895
0.902
5.36
5.37
5.42
0.931
0.936
0.931
541
5.48
5.48
0.938
0.937
0.937
observed otus: Sample D
0.908
0.913
0.920
0.923
0.939
0.940
0.936
0.927
0.940
0.902
0.902
0.903
0.941
0.937
0.950
0.924
0.930
0.948
0.931
0.926
0.939
0911
0.915
0.925
Moisture (96)
0.879
0.900
0.909
42.41
41.23
41.79
31.24
33.16
37.44
18.06
20.63
25.92
25.98
31.56
26.89
30.36
32.69
33.82
21.38
24.50
26.80
27.52
32.53
35.61
29.38
32.24
33.16
Moisture (96)
23.10
26.35
31.08
19.69
21.64
24.29
26.93
32.10
35.35
24.63
29.76
34.70
24.01
27.29
33.47
25.49
27.49
28.09
Salt (96)
16.92
25.12
28.58
2.31
2.39
2.39
2.04
2.15
2.26
1.49
1.69
2.00
1.21
1.44
1.34
2.08
2.10
2.29
1.65
1.70
2.00
1.77
1.98
2.21
populations of the aged Gouda cheeses. Bacillaceae sequen-
cing reads decreased during aging and comprised 65.8,
47.9, 36.7, and 29.0% of the population of Gouda cheeses
aged for 2-4, 4-6, 6-9, and 12-18 months, respectively.
The reverse was observed for Lactococcus, where pop-
ulations increased during aging: this genus comprised
33.7, 37.6, 54.2, and 58.5% of the populations, re-
spectively. Lactobacillus and Streptococcus populations
were 0.3 and 0.4% in the Gouda cheese that was aged
for 2-4 months, respectively. In the 12-18 month
aged Gouda, the populations were 4.8 and 0.2%, re-
spectively. For the Gouda sample aged 4-6 months,
1.71
1.79
1.87
Salt (96)
1.43
1.69
1.81
1.71
2.00
2.25
1.42
1.96
1.74
1.38
1.99
1.85
1.24
1.62
1.61
1.57
2.05
1.94
Fat in solids (96)
1.49
2.05
2.17
22 22 22 223 224 22 22 22%
43.09
53.96
55.91
51.62
Page 5 of 13
Fat in solids (96)
22 223 224 225 226 225 225
49.01
Staphylococcus comprised 81.1 % in the samples taken
under the rind. Staphylococcus comprised a lower per-
centage of total sequencing reads in the Gouda aged
for 6-9 or 12-18 months (50.2 or 45.2%, respect-
ively). Less than 1% of the population of the 2-
4-month aged Gouda cheese samples taken under the
rind was Staphylococcus.
![goal of this study was to determine the baseline micro-
biota associated with Gouda cheese via 16S rDNA
metagenomic sequencing. Gouda cheese in particular
was selected as the model product because it is an aged
cheese that is required to be held at 235 °F for at least
60 days if manufactured from unpasteurized milk in
order to ensure product safety. Variables examined in
this study included milk type (i.e. unpasteurized, pas-
teurized), milk origin (i.e. bovine, caprine), aging dur-
ation (from 2 to 4 to 12-18 months), and sampling
location (i.e. inner or outer cheese). Elucidation of the
native microbiota of Gouda cheese will allow estimation
of product quality potential and overall safety.
Results
Composition analysis of commercial gouda cheese
In this study, Gouda cheese samples were analyzed for
moisture, salt, fat, pH, and aw to assess variations in
these physical property characteristics (see Tables 1 and 2).
All cheese samples met the CFR requirement for moisture
content (maximum of 45 % ) [25], however a wide range
of values were determined: 18.06 (brand C, under the
rind) to 42.41% (brand A, under the rind). The Gouda
cheeses made with goat milk (F-H) had the highest fat
in solid content: 51.62-55.91%. Fat content ranged
from 43.09 (brand D) to 55.91% (brand G) . Brands D, I,
K, and N had slightly lower fat in solid content than
the 45% minimum specified in the CFR, ranging from
43.09-44.25%.
The pH of the Gouda cheese samples ranged from
5.26-6.37. pH was highest in samples removed from
under the rind compared with the respective core and
inside samples for 11 brands (73%). The sample taken
under the rind of brand A had the highest pH overall
(6.37). This brand also had the lowest overall pH in
the core sample (5.26), leading to a pH difference be-
tween the two regions of 1.11; a similar difference of
1.02 was also observed in brand I. All other brands
had pH differences between regions of less than 0.53.
Overall, no substantial differences in pH values were
observed between pasteurized and unpasteurized
Gouda cheeses.
The aw of the cheese samples ranged from 0.877
(brand C, under the rind) to 0.957 (brand A, both core
and inside). In general, the water activity under the rind
was lower than the inside or core samples from the same
brand. Similarly to pH, differences in aw values between
pasteurized and unpasteurized Gouda cheeses were in-
significant. The largest water activity difference between
regions of the same brand was 0.030 observed in brand.
O (0.879 in the sample taken under the rind and 0.909
in the inside sample). A correlation between moisture
content and water activity was observed; cheeses which
had low moisture contents also had low water activities,
which was expected. Salt content for the cheeses ranged
from 1.21-2.39%.
Native microbiota assessment in commercial gouda
cheese
Rarefaction curves of all Gouda cheese samples had simi-
lar diversity (Fig. 1). All samples displayed similar rarefac-
tion curves in this study. Figure 2 displays the bacterial
composition of the pasteurized and unpasteurized Gouda
cheeses based on percentage of sequence reads identified
at the family or genus levels. Identifications greater than
1% and common to cheeses included the genera of
Lactococcus and Staphylococcus, and unidentified
members of the family Bacillaceae. The family Bacillaceae
included organisms which could not be further identified
to genus. Lactococcus populations were comparable
and ranged from 40.1-49.1%. Bacteria from the family
Bacillaceae comprised 40.5, 38.5, and 46.3% of the
population of pasteurized cow and goat cheese and
unpasteurized cow Gouda cheese, respectively. Staphylococcus
reads were found in low numbers in the three cheese
categories: 2.0, 13.4, and 1.3% of the population of
pasteurized cow, goat, and unpasteurized cow Gouda
cheeses, respectively.
A total of 92, 138, and 120 genus- or family-level iden-
tifications were made for pasteurized cow, pasteurized
goat, and unpasteurized cow Gouda cheeses, respect-
ively. Eight bacterial genera were identified only in pas-
teurized cow Gouda cheese and included Anoxybacillus,
Curtobacterium, and Yersinia. A total of 28 genera were
identified only in the pasteurized goat Gouda cheese in
this study and included Mannheimia, Leptotrichia, Bal-
neimonas, Klebsiella, and Pseudoalteromonas.
Spatial variability of bacterial genera in commercial
gouda cheese
Kronograhs of the bacterial composition of the core,
under the rind, and the inside of the commercial
Gouda cheeses assessed in this study are presented in
Fig. 3. A total of 41 bacterial genera were common to
all three locations (core, under the rind, and inside)
including Lactococcus (55.1, 41.5, and 46.6 % ) , uniden-
tified members of Bacillaceae (40.9, 43.1, and 40.6 % ) ,
Lactobacillus (2.8, 0.2, and 5.1%), Staphylococcus
(0.02, 9.6, and 6.0%), and Tetragenococcus (0.004, 4.8,
and 0.03%). Overall, the composition of the cores and
insides of the Gouda cheeses were more similar to
each other based on sequence reads than to the sam-
ples taken under the rind. Lactococcus and Lactobacil-
lus populations were less in the samples taken under
the rind. Generally, all the bacterial genera identified
in this study were present in all three cheese regions.
However, Megasphaera, Caloramator, and Hymonella,
were only detected in the cheese cores, and](/v2/_next/image?url=https%3A%2F%2Fcontent.bartleby.com%2Fqna-images%2Fquestion%2Fa535256e-0857-4f61-a16c-a16363561f95%2F7bbafb04-89dd-405a-96ea-8340eedeb9cf%2Fi42otv9_processed.png&w=3840&q=75)
Transcribed Image Text:goal of this study was to determine the baseline micro-
biota associated with Gouda cheese via 16S rDNA
metagenomic sequencing. Gouda cheese in particular
was selected as the model product because it is an aged
cheese that is required to be held at 235 °F for at least
60 days if manufactured from unpasteurized milk in
order to ensure product safety. Variables examined in
this study included milk type (i.e. unpasteurized, pas-
teurized), milk origin (i.e. bovine, caprine), aging dur-
ation (from 2 to 4 to 12-18 months), and sampling
location (i.e. inner or outer cheese). Elucidation of the
native microbiota of Gouda cheese will allow estimation
of product quality potential and overall safety.
Results
Composition analysis of commercial gouda cheese
In this study, Gouda cheese samples were analyzed for
moisture, salt, fat, pH, and aw to assess variations in
these physical property characteristics (see Tables 1 and 2).
All cheese samples met the CFR requirement for moisture
content (maximum of 45 % ) [25], however a wide range
of values were determined: 18.06 (brand C, under the
rind) to 42.41% (brand A, under the rind). The Gouda
cheeses made with goat milk (F-H) had the highest fat
in solid content: 51.62-55.91%. Fat content ranged
from 43.09 (brand D) to 55.91% (brand G) . Brands D, I,
K, and N had slightly lower fat in solid content than
the 45% minimum specified in the CFR, ranging from
43.09-44.25%.
The pH of the Gouda cheese samples ranged from
5.26-6.37. pH was highest in samples removed from
under the rind compared with the respective core and
inside samples for 11 brands (73%). The sample taken
under the rind of brand A had the highest pH overall
(6.37). This brand also had the lowest overall pH in
the core sample (5.26), leading to a pH difference be-
tween the two regions of 1.11; a similar difference of
1.02 was also observed in brand I. All other brands
had pH differences between regions of less than 0.53.
Overall, no substantial differences in pH values were
observed between pasteurized and unpasteurized
Gouda cheeses.
The aw of the cheese samples ranged from 0.877
(brand C, under the rind) to 0.957 (brand A, both core
and inside). In general, the water activity under the rind
was lower than the inside or core samples from the same
brand. Similarly to pH, differences in aw values between
pasteurized and unpasteurized Gouda cheeses were in-
significant. The largest water activity difference between
regions of the same brand was 0.030 observed in brand.
O (0.879 in the sample taken under the rind and 0.909
in the inside sample). A correlation between moisture
content and water activity was observed; cheeses which
had low moisture contents also had low water activities,
which was expected. Salt content for the cheeses ranged
from 1.21-2.39%.
Native microbiota assessment in commercial gouda
cheese
Rarefaction curves of all Gouda cheese samples had simi-
lar diversity (Fig. 1). All samples displayed similar rarefac-
tion curves in this study. Figure 2 displays the bacterial
composition of the pasteurized and unpasteurized Gouda
cheeses based on percentage of sequence reads identified
at the family or genus levels. Identifications greater than
1% and common to cheeses included the genera of
Lactococcus and Staphylococcus, and unidentified
members of the family Bacillaceae. The family Bacillaceae
included organisms which could not be further identified
to genus. Lactococcus populations were comparable
and ranged from 40.1-49.1%. Bacteria from the family
Bacillaceae comprised 40.5, 38.5, and 46.3% of the
population of pasteurized cow and goat cheese and
unpasteurized cow Gouda cheese, respectively. Staphylococcus
reads were found in low numbers in the three cheese
categories: 2.0, 13.4, and 1.3% of the population of
pasteurized cow, goat, and unpasteurized cow Gouda
cheeses, respectively.
A total of 92, 138, and 120 genus- or family-level iden-
tifications were made for pasteurized cow, pasteurized
goat, and unpasteurized cow Gouda cheeses, respect-
ively. Eight bacterial genera were identified only in pas-
teurized cow Gouda cheese and included Anoxybacillus,
Curtobacterium, and Yersinia. A total of 28 genera were
identified only in the pasteurized goat Gouda cheese in
this study and included Mannheimia, Leptotrichia, Bal-
neimonas, Klebsiella, and Pseudoalteromonas.
Spatial variability of bacterial genera in commercial
gouda cheese
Kronograhs of the bacterial composition of the core,
under the rind, and the inside of the commercial
Gouda cheeses assessed in this study are presented in
Fig. 3. A total of 41 bacterial genera were common to
all three locations (core, under the rind, and inside)
including Lactococcus (55.1, 41.5, and 46.6 % ) , uniden-
tified members of Bacillaceae (40.9, 43.1, and 40.6 % ) ,
Lactobacillus (2.8, 0.2, and 5.1%), Staphylococcus
(0.02, 9.6, and 6.0%), and Tetragenococcus (0.004, 4.8,
and 0.03%). Overall, the composition of the cores and
insides of the Gouda cheeses were more similar to
each other based on sequence reads than to the sam-
ples taken under the rind. Lactococcus and Lactobacil-
lus populations were less in the samples taken under
the rind. Generally, all the bacterial genera identified
in this study were present in all three cheese regions.
However, Megasphaera, Caloramator, and Hymonella,
were only detected in the cheese cores, and
Expert Solution
This question has been solved!
Explore an expertly crafted, step-by-step solution for a thorough understanding of key concepts.

This is a popular solution!

Trending now
This is a popular solution!

Step by step
Solved in 3 steps

Knowledge Booster


Learn more about
Need a deep-dive on the concept behind this application? Look no further. Learn more about this topic, biology and related others by exploring similar questions and additional content below.Recommended textbooks for you

Comprehensive Medical Assisting: Administrative a…
Nursing
ISBN:
9781305964792
Author:
Wilburta Q. Lindh, Carol D. Tamparo, Barbara M. Dahl, Julie Morris, Cindy Correa
Publisher:
Cengage Learning
Comprehensive Medical Assisting: Administrative a…
Nursing
ISBN:
9781305964792
Author:
Wilburta Q. Lindh, Carol D. Tamparo, Barbara M. Dahl, Julie Morris, Cindy Correa
Publisher:
Cengage Learning