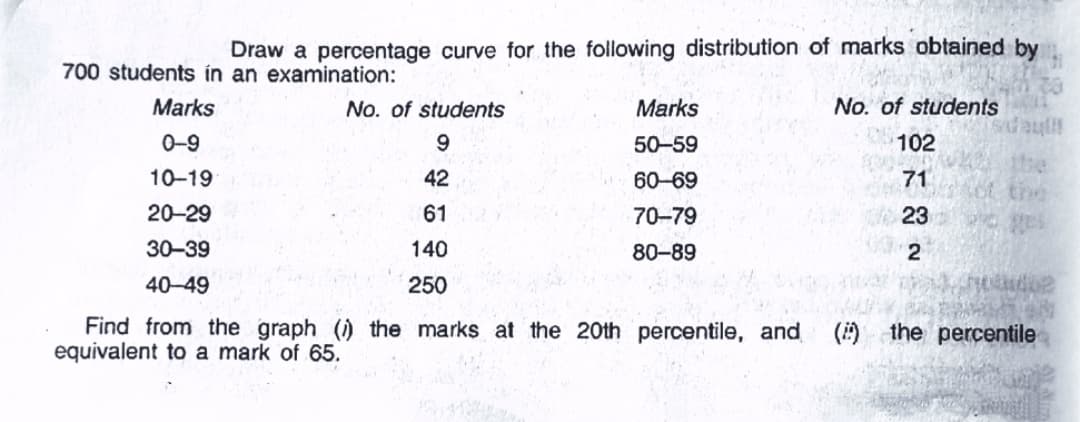
Draw a percentage curve for the following distribution of marks obtained by 700 students in an examination: Marks No. of students Marks No. of students 0-9 50-59 102 10-19 42 60-69 71 20-29 61 70-79 23 30-39 140 80-89 2 40-49 250 Find from the graph () the marks at the 20th percentile, and equivalent to a mark of 65. () the percentile
Q: The following table shows the monthly expenditures of 80 students of a No. of Students University on…
A:
Q: The following frequency distribution analyzes the scores on a math test. The class boundaries of…
A: The frequency distribution is: Scores Number of students 40 – 49 6 50 – 59 5…
Q: The scores from 50 psychology students that took a standardized test are summarized in the given…
A: The relative frequency of an individual class is defined as the ratio of the frequency of that class…
Q: The accompanying relative frequency distribution represents the last year car sales for the sales…
A:
Q: Construct the cumulative frequency distribution for the given data. Daily Low (°F) 35-39 40-44 45-49…
A: Frequency distribution table Daily low ( •F) Frequency 35-39 2 40-44 4 45-49 5 50-54 14…
Q: Refer to the graph showing the distribution of fatal traffic accidents in the United States…
A: let the total traffic facilities that happened in that year be x. by seeing the graph we can see…
Q: Construct the cumulative frequency distribution for the given data. Age (years) of Best Actress when…
A:
Q: Compute for the mean, median, mode, range, variance and standard deviation for the table below.…
A: Given: Class Interval f 70-72 2 67-69 2 64-66 4 61-63 5 58-60 11 55-57 8 52-54 4…
Q: Construct the cumulative frequency distribution for the given data. Age (years) of Best Actress when…
A:
Q: estion No 8: (ogive) showing the distribution of marks in the Draw cumulative frequency curve table…
A: Given data, Marks Frequency 30-39 2 40-49 3 50-59 11 60-69 20…
Q: The following table gives you the distribution of marks secured by some students in an examination :…
A:
Q: Compute the median given the folloving data: SCORES IN (f) STATISTICS 75 - 79 70 – 74 7 65 - 69 2 60…
A: We can find the median as below.
Q: Construct the cumulative frequency distribution for the given data. Cumulative Frequency Age (years)…
A: Total number of frequency 7 Total frequency=87
Q: Example 6 Find the median wage of the following distribution graphically: Wages (in Rs): No. of…
A: We have given that the grouped frequency table of wages and number of labourers.
Q: The Table below shows the average score of the150 students sampled from the University of the East…
A: iv. Use your results above to comment on the shape of the distribution. Give a reason for…
Q: Draw a percentile curve for the following distribution of marks obtained by 700 students at an…
A: First calculate the percentile by the formula.
Q: 8. That tall? The graph displays the cumulative relative frequency of the heights (in inches) of…
A:
Q: Construct the cumulative frequency distribution for the given data. Daily Low (°F) Frequency…
A:
Q: Construct the cumulative frequency distribution that corresponds to the given frequency…
A: The first cumulative frequency remains same as that of the frequency and the other cumulative…
Q: Approximate the mean of the frequency distribution for the ages of the residents of a town. Age…
A: The measure of central tendency is used to measure the average of observation and this measure is…
Q: Example 3 Calculate the mean of the given frequency distribution. Class intervals: 10-20 20-30 30-40…
A:
Q: Construct the cumulative frequency distribution for the given data. Age (years) of Best Actress when…
A: We have to find cumulative frequency..
Q: The manager at a water park constructed the following frequency distribution to summarize attendance…
A: Given, Attendance Frequency 1000-1250 17 1250-1500 10 1500-1750 20 1750-2000 13…
Q: Find the mode of the frequency distribution shown in Activity 2 Test Results of 100 Students in…
A: Given Class Interval f 15-24 5 25-34 10 34-44 11 45-54 23 55-64 26 65-74 14 75-84 8…
Q: Construct the cumulative frequency distribution for the given data. Daily Low Temperature (°F)…
A:
Q: What was the age distribution of nurses in Great Britain at the time of Florence Nightingale?…
A: Hello there! there are more than 3 sub parts in the question. According to our policies cannot…
Q: The following distribution represents the scores of students in Statistics exam. Find the…
A: *answer:
Q: Construct the cumulative frequency distribution for the given data. Daily Low (°F) 35-39 40-44 45-49…
A: The question is about cumulative freq. Given : To find : Cumulative freq. of data
Q: The number of phone calls arriving at a switchboard each hour has been recorded, and the following…
A:
Q: The following distribution represents the scores of students in Statistics exam. Find the…
A:
Q: The times taken (to the nearest second) by 108 athletes to run a race is given in the table below:…
A: “Since you have posted a question with multiple sub-parts, we will solve first three subparts for…
Q: The scores from 50 psychology students that took a standardized test are summarized in the given…
A: Frequency Distribution: In Statistical theory, a frequency distribution is a tabular, listed or…
Q: Here is a random sample of the body temperature of 25 young adults. 96.8 97 97.1 97.2 97.2 97.3 97.4…
A:
Q: he classified age distribution of employees of a company is given in the following table. Age group…
A: Given : Data classified in age distribution of employees of a company . We need to compute the…
Q: Q2: According to the following frequency distribution table and raw :data Frequency Distribution…
A: Given : The given data is 45, 47, 50, 51, 53, 54, 55, 56, 57, 58, 58, 60, 60, 61, 62, 63, 63, 64,…
Q: 4. Construct a Cumulative Frequency Distribution Cumulative Frequency Distribution–shows the total…
A: Classification means, arranging data into some groups according to the common nature. This…
Q: Following is the data of sales figure of a company for 100 days: Compute the average deviation.…
A: Given data : Sales and no. Of days, We have to find out average deviation :
Q: 1. The scores obtained by 44 students in Grade 10 mathematics test are distributed as follows. Class…
A: To find the class boundaries and cumulative frequency of the given frequency table. Class Boundary:…
Q: . Find the mean, median mode and standard deviation of the following set of data: CLASS INTERVAL f…
A: Introduction: Weighted Mean: The weighted mean is defined as, Mean=∑iwi xi∑iwi For the continuous…
Q: The IQ scores for a sample of 24 students who are entering their first year of high school are: 115…
A: (Since it is not mention which question to answer, as our protocol we shall answer the first…
Q: Approximate the mean of the frequency distribution for the ages of the residents of a town. Age…
A:
Q: The scores from 50 psychology students that took a standardized test are summarized in the given…
A:
Q: Approximate the mean of the frequency distribution for the ages of the residents of a town. Age…
A:
Q: The age at inauguration for each U.S. President is shown in the sequence of data values below. 57 54…
A: We are given the age for each U.S. president as raw data and we need to find the percentiles for the…
Q: Example 3: Draw the histogram, frequency curve and cumulative Frequency curve for the following…
A: For the given data, the histogram is
Q: Find the mode of the following distribution : |Class interval| 0–10 10-20 20–30 30-40 40–50 | 50-60…
A: Given data is Clas Frequency (f) 0 - 10 5 10 - 20 8 20 - 30 7 30 - 40 12 40 - 50 28…
Q: Use the frequency distribution shown below to construct an expanded frequency distribution. High…
A:
Q: The following frequency distribution analyzes the scores on a math test. Find the class midpoint of…
A: The formula for midpoint of a class is as follows: Mid point=Lower limit+Upper limit2
Q: b. On a measure of social anxiety people scored: 35, 40, 45, 40, 40, 35, 45, 50, 50, 60, 60, 70, 70,…
A: Hint: Quantitative data is data that contains numeric values.
Trending now
This is a popular solution!
Step by step
Solved in 2 steps with 2 images
- Suppose the value of a stock varies each day from $12 to $27 with a uniform distribution. Find σFind an approximate z score corresponding to a percentile of 0.33 to its RIGHT.The Normal distribution curve to the right displays the distribution of grades given to managers based on management performance at Ford. Of the large population of Ford managers, 10% were given A grades, 80% were given B grades, and 10% were given C grades. A’s were given to those who scored 380 or higher and C’s were given to those who scored 160 or lower. Suppose the company adds grades D and F so there are 5 categories to grade performance. If they want to give A’s only to those in the top 3%, what performance score must a manager exceed to get an A?
- Suppose body mass index (BMI) varies approximately normally in a population of boys aged 2-20. A national survey finds that BMI in this age group found μ=17.8 and σ=1.9. What is the cutoff to be considered in the 25th percentile of this distribution (such that this BMI is greater than 25% of BMIs).suppose the income of workers at your job follows a normal distribution. if you standardisize their income what is p (Z more than or equal to 0)The Credit Risk Department of a major bank estimates the default rate on loans under $10,000 to be 4%. The bank will make 2400 loans that are under $10,000 next month. Find the mean of ^p, where ^p is the proportion of defaults on the 2400 loans under $10,000 to be made next month.
- Assume a distribution with mean of 50 and a standard devivation of 12. For an x-value of 65, the z-score is . (two-decimal accuracy) For a z-score of -2.3, x = . (one-decimal accuracy)if raw scores ranging from 1 to 50 represented all the corresponding negative z scores on the distribution the raw scores ranging from 50 to 100 represent all the corresponding positive z scores what would be the total relative frequency of 50 to 100Suppose that historically, the proportion of people who trade in their old car to a car dealer when purchasing a new car is 48%. Over the previous six months, in a sample of 115 new car buyers, 46 have traded in their old car. To determine whether the proportion of new car buyers that trade in their old car has  statistically significantly decreased, what is the P value? (please round your answer to four decimal places)
- Suppose that, at the end of last semester, Marie gave her introductory statistics class a final exam. After grading these exams, she created a histogram illustrating the distribution of exam scores for the 70 students in the class. Each of the bars in this histogram includes only the left endpoint of the interval, except for the bar representing scores between 90 and 100 points, which also includes the right endpoint. What percentage of students scored between 60 and 80 points on the exam? Round your answer to the nearest tenth of a percent. Number of students who scored at least 80 points = students Percentage of students who scored between 60 and 80 points = %Suppose that, at the end of last semester, Marie gave her introductory statistics class a final exam. After grading these exams, she created a histogram illustrating the distribution of exam scores for the 64 students in the class. Each of the bars in this histogram includes only the left endpoint of the interval, except for the bar representing scores between 90 and 100 points, which also includes the right endpoint. What percentage of students scored between 50 and 70 points on the exam? % (Round to 1 decimal place) How many students scored at least 80 points on the exam? studentsDetermine the sampling error if the grade point averages for 10 randomly selected students from aclass of 125 students has a mean of x = 2.1. Assume the grade point average of the 125 students has a mean f µ = 2.4