The times taken (to the nearest second) by 108 athletes to run a race is given in the table below: Time (Seconds) Number of Athletes 50-54 8 55-59 28 60-64 34 65-69 18 70-74 10| 75-79 8 80-84 2 (a) State the actual limits between which the times in the class 50-54 lie. (b) Construct the cumulative frequency distribution and draw the cumulative frequency curve. (c) Use your curve to estimate (i) the median, (ii) the interquartile range. (d) Draw a box and whisker plot and comment on the skewness of the distribution. (e) Find the mean and variance.
The times taken (to the nearest second) by 108 athletes to run a race is given in the table below: Time (Seconds) Number of Athletes 50-54 8 55-59 28 60-64 34 65-69 18 70-74 10| 75-79 8 80-84 2 (a) State the actual limits between which the times in the class 50-54 lie. (b) Construct the cumulative frequency distribution and draw the cumulative frequency curve. (c) Use your curve to estimate (i) the median, (ii) the interquartile range. (d) Draw a box and whisker plot and comment on the skewness of the distribution. (e) Find the mean and variance.

MATLAB: An Introduction with Applications
6th Edition
ISBN:9781119256830
Author:Amos Gilat
Publisher:Amos Gilat
Chapter1: Starting With Matlab
Section: Chapter Questions
Problem 1P

Related questions
Question
The times taken (to the nearest second) by 108 athletes to run a race is given in the table below:
|
Time (Seconds) |
Number of Athletes |
|
50-54 |
8 |
|
55-59 |
28 |
|
60-64 |
34 |
|
65-69 |
18 |
|
70-74 |
10 |
|
75-79 |
8 |
|
80-84 |
2 |
- State the actual limits between which the times in the class 50-54 lie.
(b) Construct the cumulative frequency distribution and draw the cumulative frequency curve.
- (c) Use your curve to estimate
- (i) the median,
- (ii) the
interquartile range . - (d) Draw a box and whisker plot and comment on the skewness of the distribution.
- (e) Find the mean and variance.
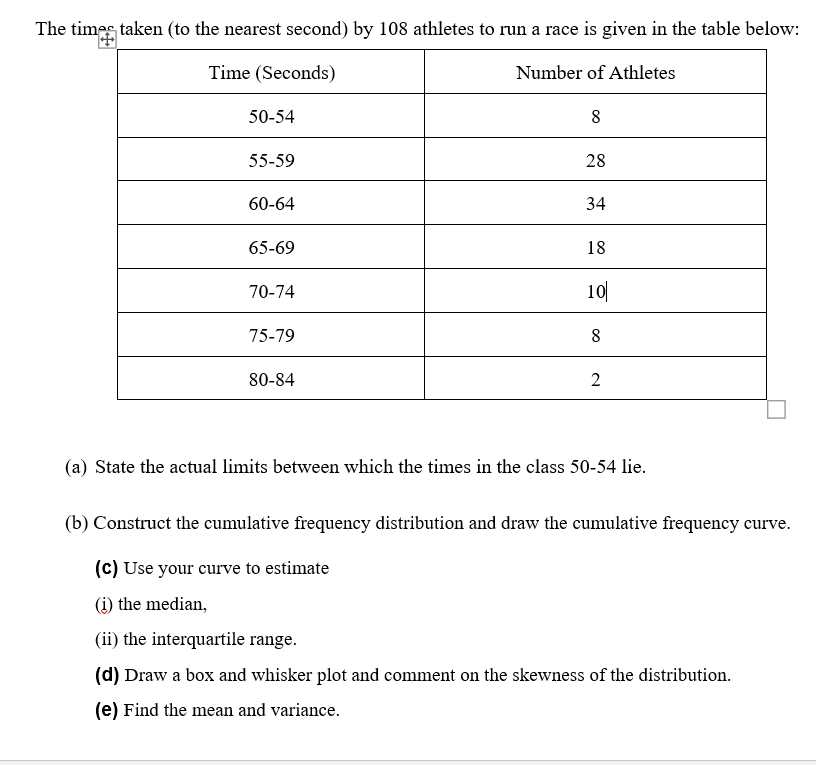
Transcribed Image Text:The times taken (to the nearest second) by 108 athletes to run a race is given in the table below:
Time (Seconds)
Number of Athletes
50-54
8
55-59
28
60-64
34
65-69
18
70-74
10|
75-79
8
80-84
2
(a) State the actual limits between which the times in the class 50-54 lie.
(b) Construct the cumulative frequency distribution and draw the cumulative frequency curve.
(c) Use your curve to estimate
(i) the median,
(ii) the interquartile range.
(d) Draw a box and whisker plot and comment on the skewness of the distribution.
(e) Find the mean and variance.
Expert Solution
This question has been solved!
Explore an expertly crafted, step-by-step solution for a thorough understanding of key concepts.

Step by step
Solved in 2 steps with 2 images

Recommended textbooks for you
MATLAB: An Introduction with Applications
Statistics
ISBN:
9781119256830
Author:
Amos Gilat
Publisher:
John Wiley & Sons Inc

Probability and Statistics for Engineering and th…
Statistics
ISBN:
9781305251809
Author:
Jay L. Devore
Publisher:
Cengage Learning

Statistics for The Behavioral Sciences (MindTap C…
Statistics
ISBN:
9781305504912
Author:
Frederick J Gravetter, Larry B. Wallnau
Publisher:
Cengage Learning
MATLAB: An Introduction with Applications
Statistics
ISBN:
9781119256830
Author:
Amos Gilat
Publisher:
John Wiley & Sons Inc
Probability and Statistics for Engineering and th…
Statistics
ISBN:
9781305251809
Author:
Jay L. Devore
Publisher:
Cengage Learning
Statistics for The Behavioral Sciences (MindTap C…
Statistics
ISBN:
9781305504912
Author:
Frederick J Gravetter, Larry B. Wallnau
Publisher:
Cengage Learning

Elementary Statistics: Picturing the World (7th E…
Statistics
ISBN:
9780134683416
Author:
Ron Larson, Betsy Farber
Publisher:
PEARSON

The Basic Practice of Statistics
Statistics
ISBN:
9781319042578
Author:
David S. Moore, William I. Notz, Michael A. Fligner
Publisher:
W. H. Freeman

Introduction to the Practice of Statistics
Statistics
ISBN:
9781319013387
Author:
David S. Moore, George P. McCabe, Bruce A. Craig
Publisher:
W. H. Freeman