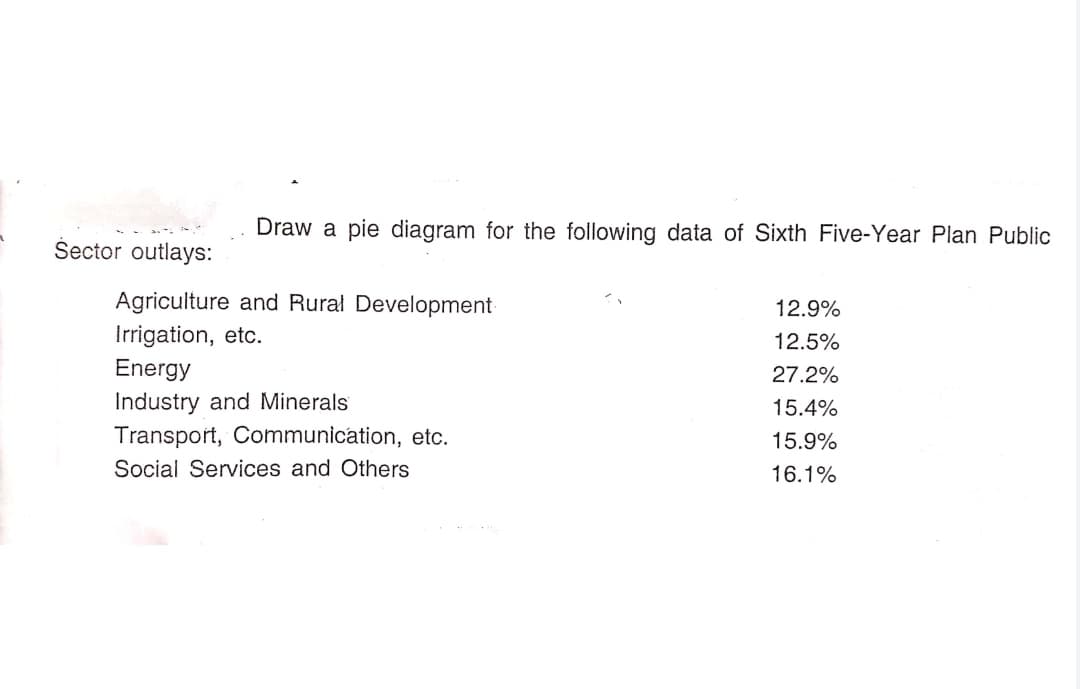
Draw a pie diagram for the following data of Sixth Five-Year Plan Public Šector outlays: Agriculture and Rural Development Irrigation, etc. 12.9% 12.5% Energy 27.2% Industry and Minerals 15.4% Transport, Communication, etc. 15.9% Social Services and Others 16.1%


Q: 1.48 Create a data set. Create a data set with five om observations for which the median would…
A: Given: n = 5 Formula Used: When n is even Median = n2thterm+n2+1thterm2 When n is odd Median =…
Q: owing dataset, what is the average salary per year? Dataset of hypothetical salaries: $45,000 per…
A: Mean is the measure of central tendency. It is calculated by dividing the sum of the values by the…
Q: Calculate price index number from the following data by : t Laspeyres Method, (i) Paasches Method,…
A:
Q: Nas corporation's manager in the stamping department have been studying the overhead cost and the…
A: Given Data : Month Overhead Machine hours January 5,030 2,730 February 1,600 600 March 7,210 3,403…
Q: present the following information in pie char,bar chart, and a table. In 2015, Interstate telephone…
A: Create a table of the given data where each entry denotes the number of relays purchased from a…
Q: To design a benefit plan for your employees, you are estimating the number of people that will…
A: Given Age of retirement =65Confidence interval =99 % Find No.of people
Q: The following data set provides infromation on acres harvested and planted by year and value in the…
A: Introduction: The asparagus-acres planted is considered to be the independent variable, and the…
Q: Draw a subdivided and percentage subdivided bar diagram for the following data year Public companies…
A: Given
Q: Rank Player Money ($) Scoring Average DrDist DrAccu GIR 1 Vijay Singh 6,601,094 70.27 297.8 59.45…
A: e.The correlation coefficient for driving distance x and accuracy y is calculated by using Excel and…
Q: Design a Single Attribute Sampling Plan that will be close to the following requirements: AQL = P. =…
A: From the given information, α=0.05β=0.10AQL=pα=0.02LTPD=pβ=0.100 Below the conditions are…
Q: A regional bank issues different types of credit cards. As part of its annual review of the…
A: The population parameters or true parameters of population are best estimated by sample parameters.…
Q: B. Refer to the following data from a Cohort study: With Lung Cancer 500 900 1,400 Smoker Non-smoker…
A: As per the guidlines we are allowed to solve only one question please put the other question…
Q: Identify the following as nominal level, ordinal level, interval level, or ratio level data. 1.…
A: Given some variables, we have to Identify the following as nominal level, ordinal level, interval…
Q: A report included the accompanying data on extra travel time for peak travel time in hours per year…
A: Construction of stem and leaf display and comment about the nature of data.
Q: The accompanying data were obtained from the financial aid office of a certain university. Not…
A: Consider A be the event for an undergraduate students selected from the university. B be the event…
Q: What is the beverage cost percentage for Bartenders 1 and 2, given the information in the following…
A: Given data of cost percentage of bartender 1 and bartender 2 as shown below the average beverage…
Q: The data in the Table below was taken from the U.S. Census Bureau report titled “HINC-01. Selected…
A:
Q: Read the following case study and answer ALL questions that follow. Royal bank is in the process of…
A: Solution : Given : Sample data of client savings 3.1 Variables in the study are - Gender, Marital…
Q: Consider the following population table. 1970 1990 State A 11,110,385| 11,427,409 11,430,802…
A: From the given table, Population of State B in 1980 = 9,263,044 Population of State B in 1990 =…
Q: The Transactional Records Access Clearinghouse at Syracuse University reported data showing the odds…
A: “Since you have posted a question with multiple sub-parts, we will solve first three subparts for…
Q: The W‐plan provides a five‐point checklist to which the media planner should refer to when…
A: Who did the survey: The researcher who collects the data and then analyse it.
Q: Use the data from Fuentes’ study to test the hypothesis that the proportion of grocery stores that…
A: From the given information, the claim is the proportion of grocery stores that currently carries…
Q: Calculate the consumer price index number for 2015 on the basis of 2000 from the following data by…
A:
Q: 35. By using a suitable interpolation formula, estimate the price for the year 1997 using the…
A:
Q: Calculate the mode of the following sample data set: 8 10 7 14 53 22 5 5 5 22
A: Given data is 8,10,7,14,53,22,5,5,5,22
Q: 2. The manager of the police department motor pool wants to develop a forecast model for annual…
A: Hi! Thank you for the question, As per the honor code, we are allowed to answer three sub-parts at a…
Q: Table 1. Population Data for Six-County Area of North Texas Total Population % of Texas 21+ Denton…
A: The term average is defined as the ratio of the sum of all the observations divided by the total…
Q: In which borough is variation across zip codes in first-dose recipiency rates largest? Brooklyn The…
A: There are different ways to measure the variation for a data set.
Q: :4:18. Draw a pie diagram to represent the following data of proposed expenditure hy a State…
A:
Q: (A) Relative Risk (RR) = (B) Odds Ratio (OR) = (C) Prevalence (P) = Exposed Nonexposed Column total…
A: Since you have posted a question with multiple sub-parts, we will solve first 3 sub-parts for you.…
Q: A report included the accompanying data on extra travel time for peak travel time in hours per year…
A: To develop a stem and leaf of the given data, we separate the unit value as the leaf and the tens…
Q: Given the following dataset, which is the proper stemplot? Data: 102, 147, 132, 122, 109, 142, 137,…
A: There is total 10 observations.
Q: An enquiry into the budgets of middle class families in a certain city gave following information:…
A: Given: Expenses Prices(2010) Prices(2011) Food 35% 1150 145 Fuel 10% 25 3 Clothing 20% 75…
Q: Rank Player Money ($) Scoring Average DrDist DrAccu GIR 1 Vijay Singh 6,601,094 70.27 297.8 59.45…
A: a).Software procedure for regression in EXCEL.Enter the given data in EXCEL sheet as Scoring average…
Q: To predict future enrollment in a school district, fifty households within the district were…
A: Given data,
Q: Construct the consumers price index from the following data using the appropriate formula. Quantity…
A:
Q: The director of a large public library must schedule employees to reshelf books and periodicals…
A:
Q: Goshen Inc.'s monthly net income for 2019 were as follow, what is the average net income? January:…
A: The solution is given as follows :
Q: Table 1 Brand Purchasing Intention Mean N Perodua 41 4.2927 Proton 54 3.6543 Toyota 53 5.0126 Honda…
A: Descriptive statistic are used to summarize the data set. It can be measured using the central…
Q: 3.24: The data in the accompanying table are from the Organization for Economic Co-operation and…
A: The given data set is: 49.30 39.70 60.60 28.10 28.90 32.60 45.90 41.10 44.0…
Q: Table 5.7 Body weight of Sprague-Dawley rats (in grams) Female Male 229 310 300 485 310 476 248 528…
A:
Q: Create a five-number summary of the data set. minimum %3D mpge mpge median = mpge Q3 = mpge maximum…
A:
Q: the table below. List Price (B) Discount Rate (R) Discount (P) Net Invoice Price NIP Rate P158.75 5%…
A: LIST PRICE = 158.75 UNIT DISCOUNT RATE = 5% : . DISCOUNT = 158.75 X 0.05 UNIT = 7.9375 UNIT : . NET…
Q: Calculate the consumer price index number for 2015 on the basis of 2000 from he following data by…
A: Given that We have to calculate Consumer Price Index number for 2015 on the basis of 2000 from the…
Q: Which quality control chart shows frequency of errors? Select one: a.Gantt chart b.Flow chart…
A: A Pareto chart is used to identify the most frequent defects which can be counted and categorized.So…
Q: 2004 2005 2006 2007 2008 Super Deluxe $86,100 $140,500 $65,800 $56,100 $59,000 Deluxe 103,200…
A: Sales of deluxe model in 2004 = $103,200 Total sales in 2004 = super deluxe + deluxe + standard =…
Q: The following data was accessed January 6, 2022: Country Total Deaths Total Cases Population…
A: We have to use world data for 1st question. Here given, Total deaths, total cases, total population,…
Q: Calculate the weighted price index from the following data : Materials Units Quantity required Price…
A:
Q: Year 2005-06 2006-07 2007-08 2008-09 2009-10 2010–11 Total FTES 1,585 |1,690| |1,735 1,935 2,021…
A: Step-by-step procedure to draw the Box plot using Excel: In Excel sheet, enter and select Year in…

Step by step
Solved in 3 steps with 3 images

- 3.24: The data in the accompanying table are from the Organization for Economic Co-operation and Development (data.oecd.org/eduatt/population-with-tertiary-education.htm, retrieved February 18, 2018). Entries in the table are the percentage of 25- to 34-year-old people who have completed a 4-year college degree for 27 countries in 2016. Country Percentage of people age 25 to 34 with 4-year degree Country Percentage of people age 25 to 34 with 4-year degree Australia 49.3 Italy 25.6 Austria 39.7 Japan 60.1 Canada 60.6 Mexico 21.8 Colombia 28.1 New Zealand 43.4 Costa Rica 28.9 Norway 48.6 Czech Republic 32.6 Poland 43.5 Denmark 45.9 Portugal 35.0 Finland 41.1 Spain 41.0 France 44.0 Sweden 47,.2 Germany 30.5 Switzerland 48.8 Greece 41.0 Turkey 30.5 Hungary 30.4 United Kingdom 52.0 Iceland 43.3 United States 47.5 Israel 47.4…Cincinnati Paint Company sells quality brands of paints through hardware stores throughout the United States. The company maintains a large sales force who call on existing customers and look for new business. The national sales manager is investigating the relationship between the number of sales calls made and the miles driven by the sales representative. Also, do the sales representatives who drive the most miles and make the most calls necessarily earn the most in sales commissions? To investigate, the vice president of sales selected a sample of 25 sales representatives and determined: The amount earned in commissions last month (y) The number of miles driven last month (x1) The number of sales calls made last month (x2) The information is reported below. Commissions ($000) Calls Driven Commissions ($000) Calls Driven 23 68 2,372 39 188 3,291 14 30 2,229 44 218 3,103 34 136 2,733 29 105 2,123 39 180 3,353 38 162 2,794 24 77 2,291 37 154 3,209 47 186 3,451 15 25…Cincinnati Paint Company sells quality brands of paints through hardware stores throughout the United States. The company maintains a large sales force who call on existing customers and look for new business. The national sales manager is investigating the relationship between the number of sales calls made and the miles driven by the sales representative. Also, do the sales representatives who drive the most miles and make the most calls necessarily earn the most in sales commissions? To investigate, the vice president of sales selected a sample of 25 sales representatives and determined: The amount earned in commissions last month (y) The number of miles driven last month (x1) The number of sales calls made last month (x2) The information is reported below. Commissions ($000) Calls Driven Commissions ($000) Calls Driven 22 143 2,375 38 150 3,291 13 132 2,228 45 145 3,103 33 148 2,735 29 147 2,122 39 146 3,354 38 146 2,795 24 142 2,291 38 153 3,213 48 142 3,449…
- 2) A sample of single persons receiving social security payments revealed these monthly benefits: $965, $826, $699, $1,087, $880, $839, $1346, $820 and $965. How many observations are below the mode?Identify the following as nominal level, ordinal level, interval level, or ratio level data.1. Flavors of frozen yogurt2. Amount of money in savings accounts3. Students classified by their reading ability: above average, below average, normal4. Letter grades on an English essay5. Religions6. Commuting times to work7. Ages (in years) of art students8. Ice cream flavor preference9. Years of important historical events10. Instructors classified as: Easy, Difficult or ImpossibleIn the dataset represented by the following stemplot, how many times does the number “33” occur? Leaf unit = 1.0.
- A regional bank issues different types of credit cards. As part of its annual review of the profitability of each type of credit card, the bank randomly samples 36 customers to measure the average quarterly charges per card. A random sample of 36 accounts from one type of credit card shows the accompanying spending per account (rounded to the nearest dollar). Complete parts a through e below. Data on Credit Card Spending: Credit Card Spending$2,373 $4,197 $3,711 $2,324 $2,782 $2,635$2,628 $2,968 $2,954 $2,550 $2,401 $1,363$1,797 $1,993 $2,539 $3,233 $2,855 $1,630 $2,169 $3,249 $3,428 $1,932 $3,067 $2,340$2,991 $2,245 $3,496 $2,697 $2,983 $3,138$1,600 $2,852 $2,739 $2,132 $2,885 $3,243 a. Based on these randomly sampled accounts, what is the best point estimate of the true mean quarterly spending for credit card account holders? $ (Round to the nearest cent as needed.)The following data set provides infromation on acres harvested and planted by year and value in the US. Year ASPARAGUS - ACRES HARVESTED ASPARAGUS - ACRES PLANTED 2015 21,700 23,500 2014 23,800 25,800 2013 24,500 26,800 2012 25,300 27,800 2011 26,800 28,400 2010 28,000 29,200 2009 29,200 30,700 2008 32,200 33,700 2007 38,600 40,900 2006 43,200 44,700 2005 49,300 51,700 2004 61,500 66,000 2003 58,000 62,000 2002 66,000 70,500 2001 70,150 75,150 2000 77,400 82,800 1999 75,890 79,590 1998 74,430 From the data set, use the planting data for the United States for recent years. Using a calculator or statistical software, find the equation for the linear regression line for 2010 to 2015. What is the pattern of the data set? Select the correct answer below: Positive linear pattern No pattern Negative linear pattern…The following chart is published in a professional report on state government spending. Identify four significant critiques of this chart. Draw on class instruction/discussion on professional chart design.
- 3. Construct frequency distribution table4. Construct graph ( frequency polygon, histogram, ogive<>, and pie chartThe National Assessment for Educational Progress (NAEP) is a U.S. government organization that assesses the performance of students and schools at all levels across the United States. The following table presents the percentage of eighth-grade students who were found to be proficient in mathematics and the percentage who were found to be proficient in reading in each of the ten most populous states. Use excels to find: State Percentage Proficient in Reading Percentage Proficient in Mathematics California 60 59 Texas 73 78 New York 75 70 Florida 66 68 Illinois 75 70 Pennsylvania 79 77 Ohio 79 76 Michigan 73 66 Georgia 67 64 North Carolina 71 73 Activities: Construct a scatterplot with reading proficiency on the horizontal axis and math proficiency on the vertical axis. Is there a linear relationship? Compute the correlation between reading proficiency and math proficiency. Is the linear…Plastics which are no longer needed for current use end up being recycled, or incinerated, or discarded into landfills or the natural environment. According to the 2016- 17 Australian Plastics Recycling Survey, the term ‘recycling’ is used in the plastics industry “to cover a range of activities including collection, sorting, reprocessing, export for reprocessing and manufacture of new products.” In order to avoid double-counting materials, survey data is typically collected on the reprocessing stage, which is the stage where waste plastics are converted into a new product (may be finished or semi-finished).


