The Transactional Records Access Clearinghouse at Syracuse University reported data showing the odds of an Internal Revenue Service audit. The following table shows the average adjusted gross income reported (in dollars) and the percent of the returns that were audited for 20 selected IRS districts. Adjusted Gross Income ($) Percent Audited District Los Angeles 36,664 1.3 Sacramento 38,845 1.1 Atlanta 34,886 1.1 Boise 32,512 1.1 Dallas 34,531 1.0 Providence 35,995 1.0 San Jose 37,799 0.9 Cheyenne 33,876 0.9 Fargo 30,513 0.9 New Orleans 30,174 0.9 Oklahoma City 30,060 0.8 Houston 37,153 0.8 Portland 34,918 0.7 Phoenix 33,291 0.7 Augusta 31,504 0.7 Albuquerque 29,199 0.6 Greensboro 33,072 0.6 Columbia 30,859 0.5 Nashville 32,566 0.5 Buffalo 34,296 0.5 (a) Develop the estimated regression equation that could be used to predict the percent audited given the average adjusted gross income reported (in dollars). (Round your value for the y-intercept to three decimal places and your value for the slope to six decimal places.) (b) At the 0.05 level of significance, determine whether the adjusted gross income (in dollars) and the percent audited are related. (Use the F test.) State the null and alternative hypotheses. O Hạ: B0 time left O Ho: B, 20 2:41:15 O Ho: B0 H = 0 O Hoi Bo =0 O Hai Bq = 0 Find the value of the test statistic. (Round your answer to two decimal places.) Find the p-value. (Round your answer to three decimal places.) p-value = State your conclusion. O Do not reject Hg. We conclude that the relationship between the adjusted gross income (in dollars) and the percent audited is significant. O Do not reject Hg. We cannot conclude that the relationship between the adjusted gross income (in dollars) and the percent audited is significant. O Reject Hg. We conclude that the relationship between the adjusted gross income (in dollars) and the percent audited is significant. O Reject Hg. We cannot conclude that the relationship between the adjusted gross income (in dollars) and the percent audited is significant. (c) Did the estimated regression equation provide a good fit? Explain. (Round your answer to three decimal places.) Since =[ is -Select v, the estimated regression equation -Select- - va good fit. (d) Use the estimated regression equation developed in part (a) to calculate a 95% confidence interval for the expected percent audited for districts with an average adjusted gross income of $34,000. (Round your answers to two decimal places.) % to
The Transactional Records Access Clearinghouse at Syracuse University reported data showing the odds of an Internal Revenue Service audit. The following table shows the average adjusted gross income reported (in dollars) and the percent of the returns that were audited for 20 selected IRS districts. Adjusted Gross Income ($) Percent Audited District Los Angeles 36,664 1.3 Sacramento 38,845 1.1 Atlanta 34,886 1.1 Boise 32,512 1.1 Dallas 34,531 1.0 Providence 35,995 1.0 San Jose 37,799 0.9 Cheyenne 33,876 0.9 Fargo 30,513 0.9 New Orleans 30,174 0.9 Oklahoma City 30,060 0.8 Houston 37,153 0.8 Portland 34,918 0.7 Phoenix 33,291 0.7 Augusta 31,504 0.7 Albuquerque 29,199 0.6 Greensboro 33,072 0.6 Columbia 30,859 0.5 Nashville 32,566 0.5 Buffalo 34,296 0.5 (a) Develop the estimated regression equation that could be used to predict the percent audited given the average adjusted gross income reported (in dollars). (Round your value for the y-intercept to three decimal places and your value for the slope to six decimal places.) (b) At the 0.05 level of significance, determine whether the adjusted gross income (in dollars) and the percent audited are related. (Use the F test.) State the null and alternative hypotheses. O Hạ: B0 time left O Ho: B, 20 2:41:15 O Ho: B0 H = 0 O Hoi Bo =0 O Hai Bq = 0 Find the value of the test statistic. (Round your answer to two decimal places.) Find the p-value. (Round your answer to three decimal places.) p-value = State your conclusion. O Do not reject Hg. We conclude that the relationship between the adjusted gross income (in dollars) and the percent audited is significant. O Do not reject Hg. We cannot conclude that the relationship between the adjusted gross income (in dollars) and the percent audited is significant. O Reject Hg. We conclude that the relationship between the adjusted gross income (in dollars) and the percent audited is significant. O Reject Hg. We cannot conclude that the relationship between the adjusted gross income (in dollars) and the percent audited is significant. (c) Did the estimated regression equation provide a good fit? Explain. (Round your answer to three decimal places.) Since =[ is -Select v, the estimated regression equation -Select- - va good fit. (d) Use the estimated regression equation developed in part (a) to calculate a 95% confidence interval for the expected percent audited for districts with an average adjusted gross income of $34,000. (Round your answers to two decimal places.) % to

MATLAB: An Introduction with Applications
6th Edition
ISBN:9781119256830
Author:Amos Gilat
Publisher:Amos Gilat
Chapter1: Starting With Matlab
Section: Chapter Questions
Problem 1P

Related questions

Question
Transcribed Image Text:11.
DETAILS
ASWSBE14 14.E.067.
MY NOTES
ASK YOUR TEACHER
PRACTICE ANOTHER
DATAfile: IRSAudit
A statistical program is recommended.
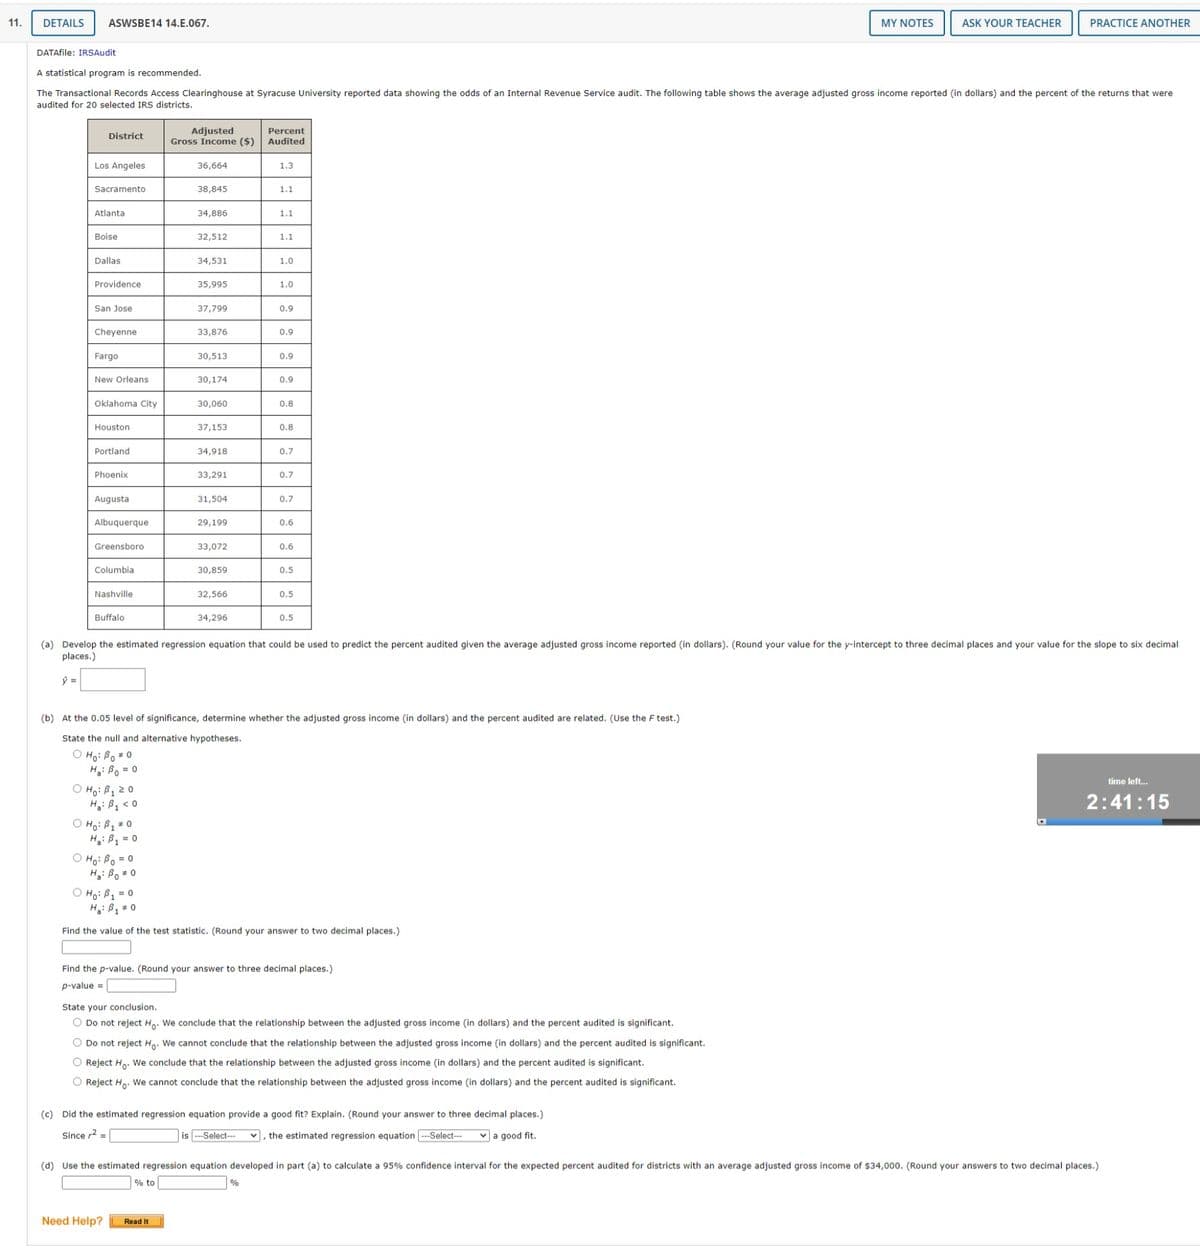
The Transactional Records Access Clearinghouse at Syracuse University reported data showing the odds of an Internal Revenue Service audit. The following table shows the average adjusted gross income reported (in dollars) and the percent of the returns that were
audited for 20 selected IRS districts.
Adjusted
Gross Income ($)
Percent
Audited
District
Los Angeles
36,664
1.3
Sacramento
38,845
1.1
Atlanta
34,886
1.1
Boise
32,512
1.1
Dallas
34,531
1.0
Providence
35,995
1.0
San Jose
37,799
0.9
Cheyenne
33,876
0.9
Fargo
30,513
0.9
New Orleans
30,174
0.9
Oklahoma City
30,060
0.8
Houston
37,153
0.8
Portland
34,918
0.7
Phoenix
33,291
0.7
Augusta
31,504
0.7
Albuquerque
29,199
0.6
Greensboro
33,072
0.6
Columbia
30,859
0.5
Nashville
32,566
0.5
Buffalo
34,296
0.5
(a) Develop the estimated regression equation that could be used to predict the percent audited given the average adjusted gross income reported (in dollars). (Round your value for the y-intercept to three decimal places and your value for the slope to six decimal
places.)
(b) At the 0.05 level of significance, determine whether the adjusted gross income (in dollars) and the percent audited are related. (Use the F test.)
State the null and alternative hypotheses.
O Ho: Bo# 0
H: Bo = 0
O Ho: B1 2 0
H: B, < 0
O Hoi B1 * 0
H: B1 = 0
time left.
2:41:15
O Ho: Bo = 0
H: Bo 0
O Ho: B1 = 0
H: B = 0
Find the value of the test statistic. (Round your answer to two decimal places.)
Find the p-value. (Round your answer to three decimal places.)
p-value =
State your conclusion.
O Do not reject H. We conclude that the relationship between the adjusted gross income (in dollars) and the percent audited is significant.
O Do not reject Ho. We cannot conclude that the relationship between the adjusted gross income (in dollars) and the percent audited is significant.
O Reject Ha. We conclude that the relationship between the adjusted gross income (in dollars) and the percent audited is significant.
O Reject H,. We cannot conclude that the relationship between the adjusted gross income (in dollars) and the percent audited is significant.
(c) Did the estimated regression equation provide a good fit? Explain. (Round your answer to three decimal places.)
Since r2 =
is ---Select--
, the estimated regression equation -Select--
v a good fit.
(d) Use the estimated regression equation developed in part (a) to calculate a 95% confidence interval for the expected percent audited for districts with an average adjusted gross income of $34,000. (Round your answers to two decimal places.)
% to
%
Need Help?
Read It
Expert Solution
This question has been solved!
Explore an expertly crafted, step-by-step solution for a thorough understanding of key concepts.

This is a popular solution!

Trending now
This is a popular solution!

Step by step
Solved in 4 steps

Knowledge Booster


Learn more about
Need a deep-dive on the concept behind this application? Look no further. Learn more about this topic, statistics and related others by exploring similar questions and additional content below.Recommended textbooks for you
MATLAB: An Introduction with Applications
Statistics
ISBN:
9781119256830
Author:
Amos Gilat
Publisher:
John Wiley & Sons Inc

Probability and Statistics for Engineering and th…
Statistics
ISBN:
9781305251809
Author:
Jay L. Devore
Publisher:
Cengage Learning

Statistics for The Behavioral Sciences (MindTap C…
Statistics
ISBN:
9781305504912
Author:
Frederick J Gravetter, Larry B. Wallnau
Publisher:
Cengage Learning
MATLAB: An Introduction with Applications
Statistics
ISBN:
9781119256830
Author:
Amos Gilat
Publisher:
John Wiley & Sons Inc
Probability and Statistics for Engineering and th…
Statistics
ISBN:
9781305251809
Author:
Jay L. Devore
Publisher:
Cengage Learning
Statistics for The Behavioral Sciences (MindTap C…
Statistics
ISBN:
9781305504912
Author:
Frederick J Gravetter, Larry B. Wallnau
Publisher:
Cengage Learning

Elementary Statistics: Picturing the World (7th E…
Statistics
ISBN:
9780134683416
Author:
Ron Larson, Betsy Farber
Publisher:
PEARSON

The Basic Practice of Statistics
Statistics
ISBN:
9781319042578
Author:
David S. Moore, William I. Notz, Michael A. Fligner
Publisher:
W. H. Freeman

Introduction to the Practice of Statistics
Statistics
ISBN:
9781319013387
Author:
David S. Moore, George P. McCabe, Bruce A. Craig
Publisher:
W. H. Freeman