Draw the histogram for these data using an initial class boundary of 0.5 and a class width of 9. Note that you can add or remove classes from the figure. Label each class with its endpoints.
Draw the histogram for these data using an initial class boundary of 0.5 and a class width of 9. Note that you can add or remove classes from the figure. Label each class with its endpoints.

Glencoe Algebra 1, Student Edition, 9780079039897, 0079039898, 2018
18th Edition
ISBN:9780079039897
Author:Carter
Publisher:Carter
Chapter10: Statistics
Section10.5: Comparing Sets Of Data
Problem 26PFA

Related questions
Question
Transcribed Image Text:AA
A www-awn.aleks.com
Home | iC...
G *State Poli...
A Police Offi...
a s&S Prop...
Pf iCampus L...
Bb Week 8 ...
X ALEKS - S...
O DESCRIPTIVE STATISTICS
Shasia v
Histograms for grouped...
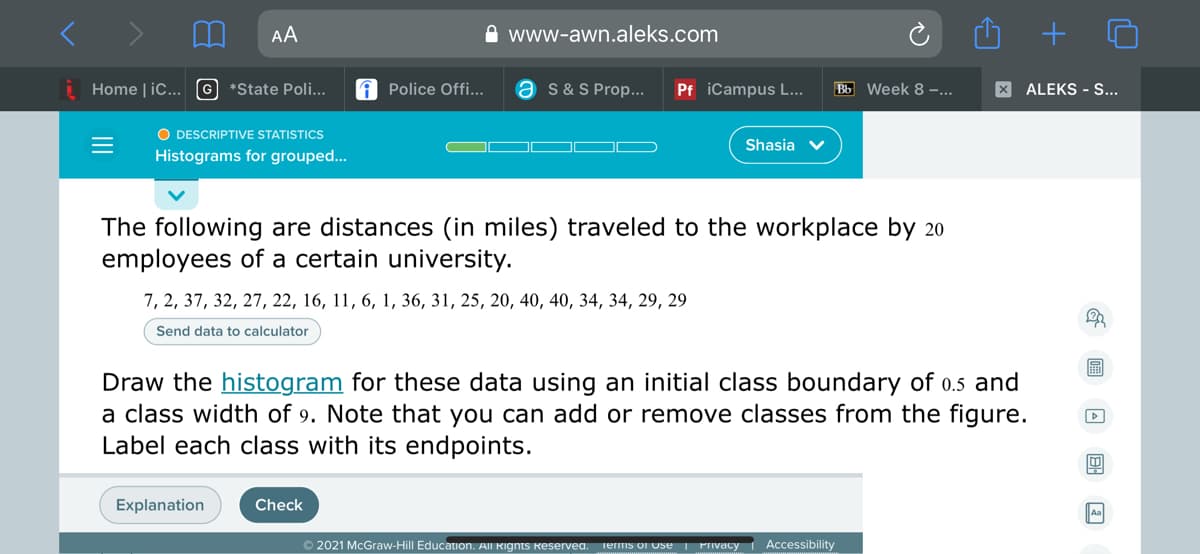
The following are distances (in miles) traveled to the workplace by 20
employees of a certain university.
7, 2, 37, 32, 27, 22, 16, 11, 6, 1, 36, 31, 25, 20, 40, 40, 34, 34, 29, 29
Send data to calculator
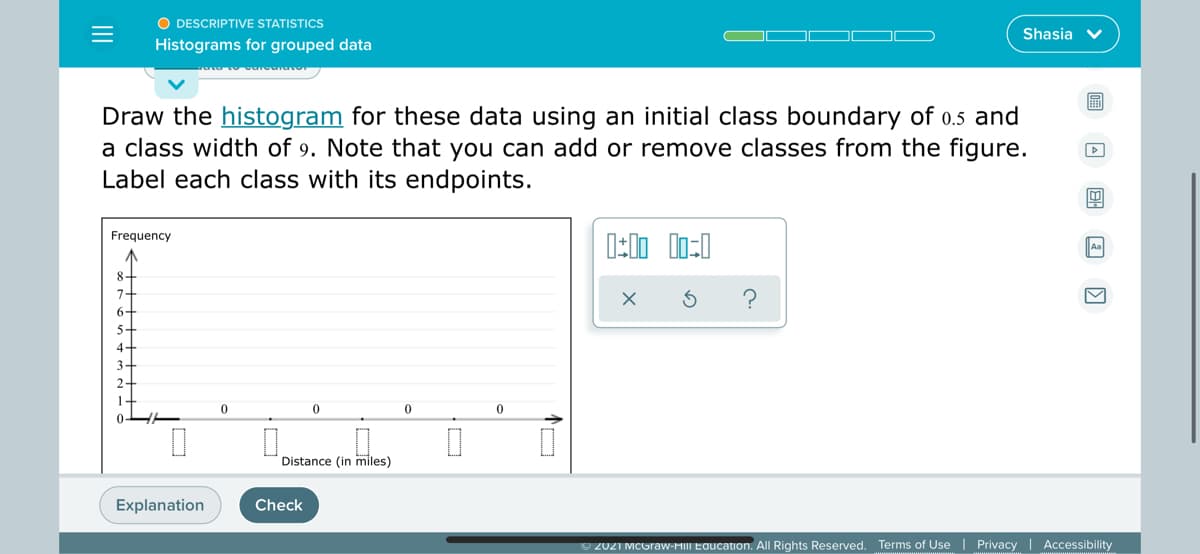
Draw the histogram for these data using an initial class boundary of 0.5 and
a class width of 9. Note that you can add or remove classes from the figure.
Label each class with its endpoints.
Explanation
Check
© 2021 McGraw-Hill Education. All Rignts keservea.
Terms of Use
Privacy
Accessibility
Transcribed Image Text:O DESCRIPTIVE STATISTICS
Shasia v
Histograms for grouped data
Draw the histogram for these data using an initial class boundary of 0.5 and
a class width of 9. Note that you can add or remove classes from the figure.
Label each class with its endpoints.
Frequency
Aa
8-
7-
6-
5-
4-
3-
2-
Distance (in miles)
Explanation
Check
O 2021 MCGraw-HIII Education. All Rights Reserved. Terms of Use | Privacy | Accessibility
Expert Solution
Step 1
For the given information, the frequency distribution is,
| Class interval | frequency |
| 0.5-9.5 | 4 |
| 9.5-18.5 | 2 |
| 18.5-27.5 | 4 |
| 27.5-36.5 | 7 |
| 36.5-45.5 | 3 |
| 45.5-54.5 | 0 |
| 54.5-63.5 | 0 |
| 63.5-72.5 | 0 |
| 72.5-81.5 | 0 |

Trending now
This is a popular solution!

Step by step
Solved in 2 steps with 1 images

Knowledge Booster


Learn more about
Need a deep-dive on the concept behind this application? Look no further. Learn more about this topic, statistics and related others by exploring similar questions and additional content below.Recommended textbooks for you
Glencoe Algebra 1, Student Edition, 9780079039897…
Algebra
ISBN:
9780079039897
Author:
Carter
Publisher:
McGraw Hill

Holt Mcdougal Larson Pre-algebra: Student Edition…
Algebra
ISBN:
9780547587776
Author:
HOLT MCDOUGAL
Publisher:
HOLT MCDOUGAL
Glencoe Algebra 1, Student Edition, 9780079039897…
Algebra
ISBN:
9780079039897
Author:
Carter
Publisher:
McGraw Hill
Holt Mcdougal Larson Pre-algebra: Student Edition…
Algebra
ISBN:
9780547587776
Author:
HOLT MCDOUGAL
Publisher:
HOLT MCDOUGAL