
MATLAB: An Introduction with Applications
6th Edition
ISBN: 9781119256830
Author: Amos Gilat
Publisher: John Wiley & Sons Inc
expand_more
expand_more
format_list_bulleted
Related questions
Question
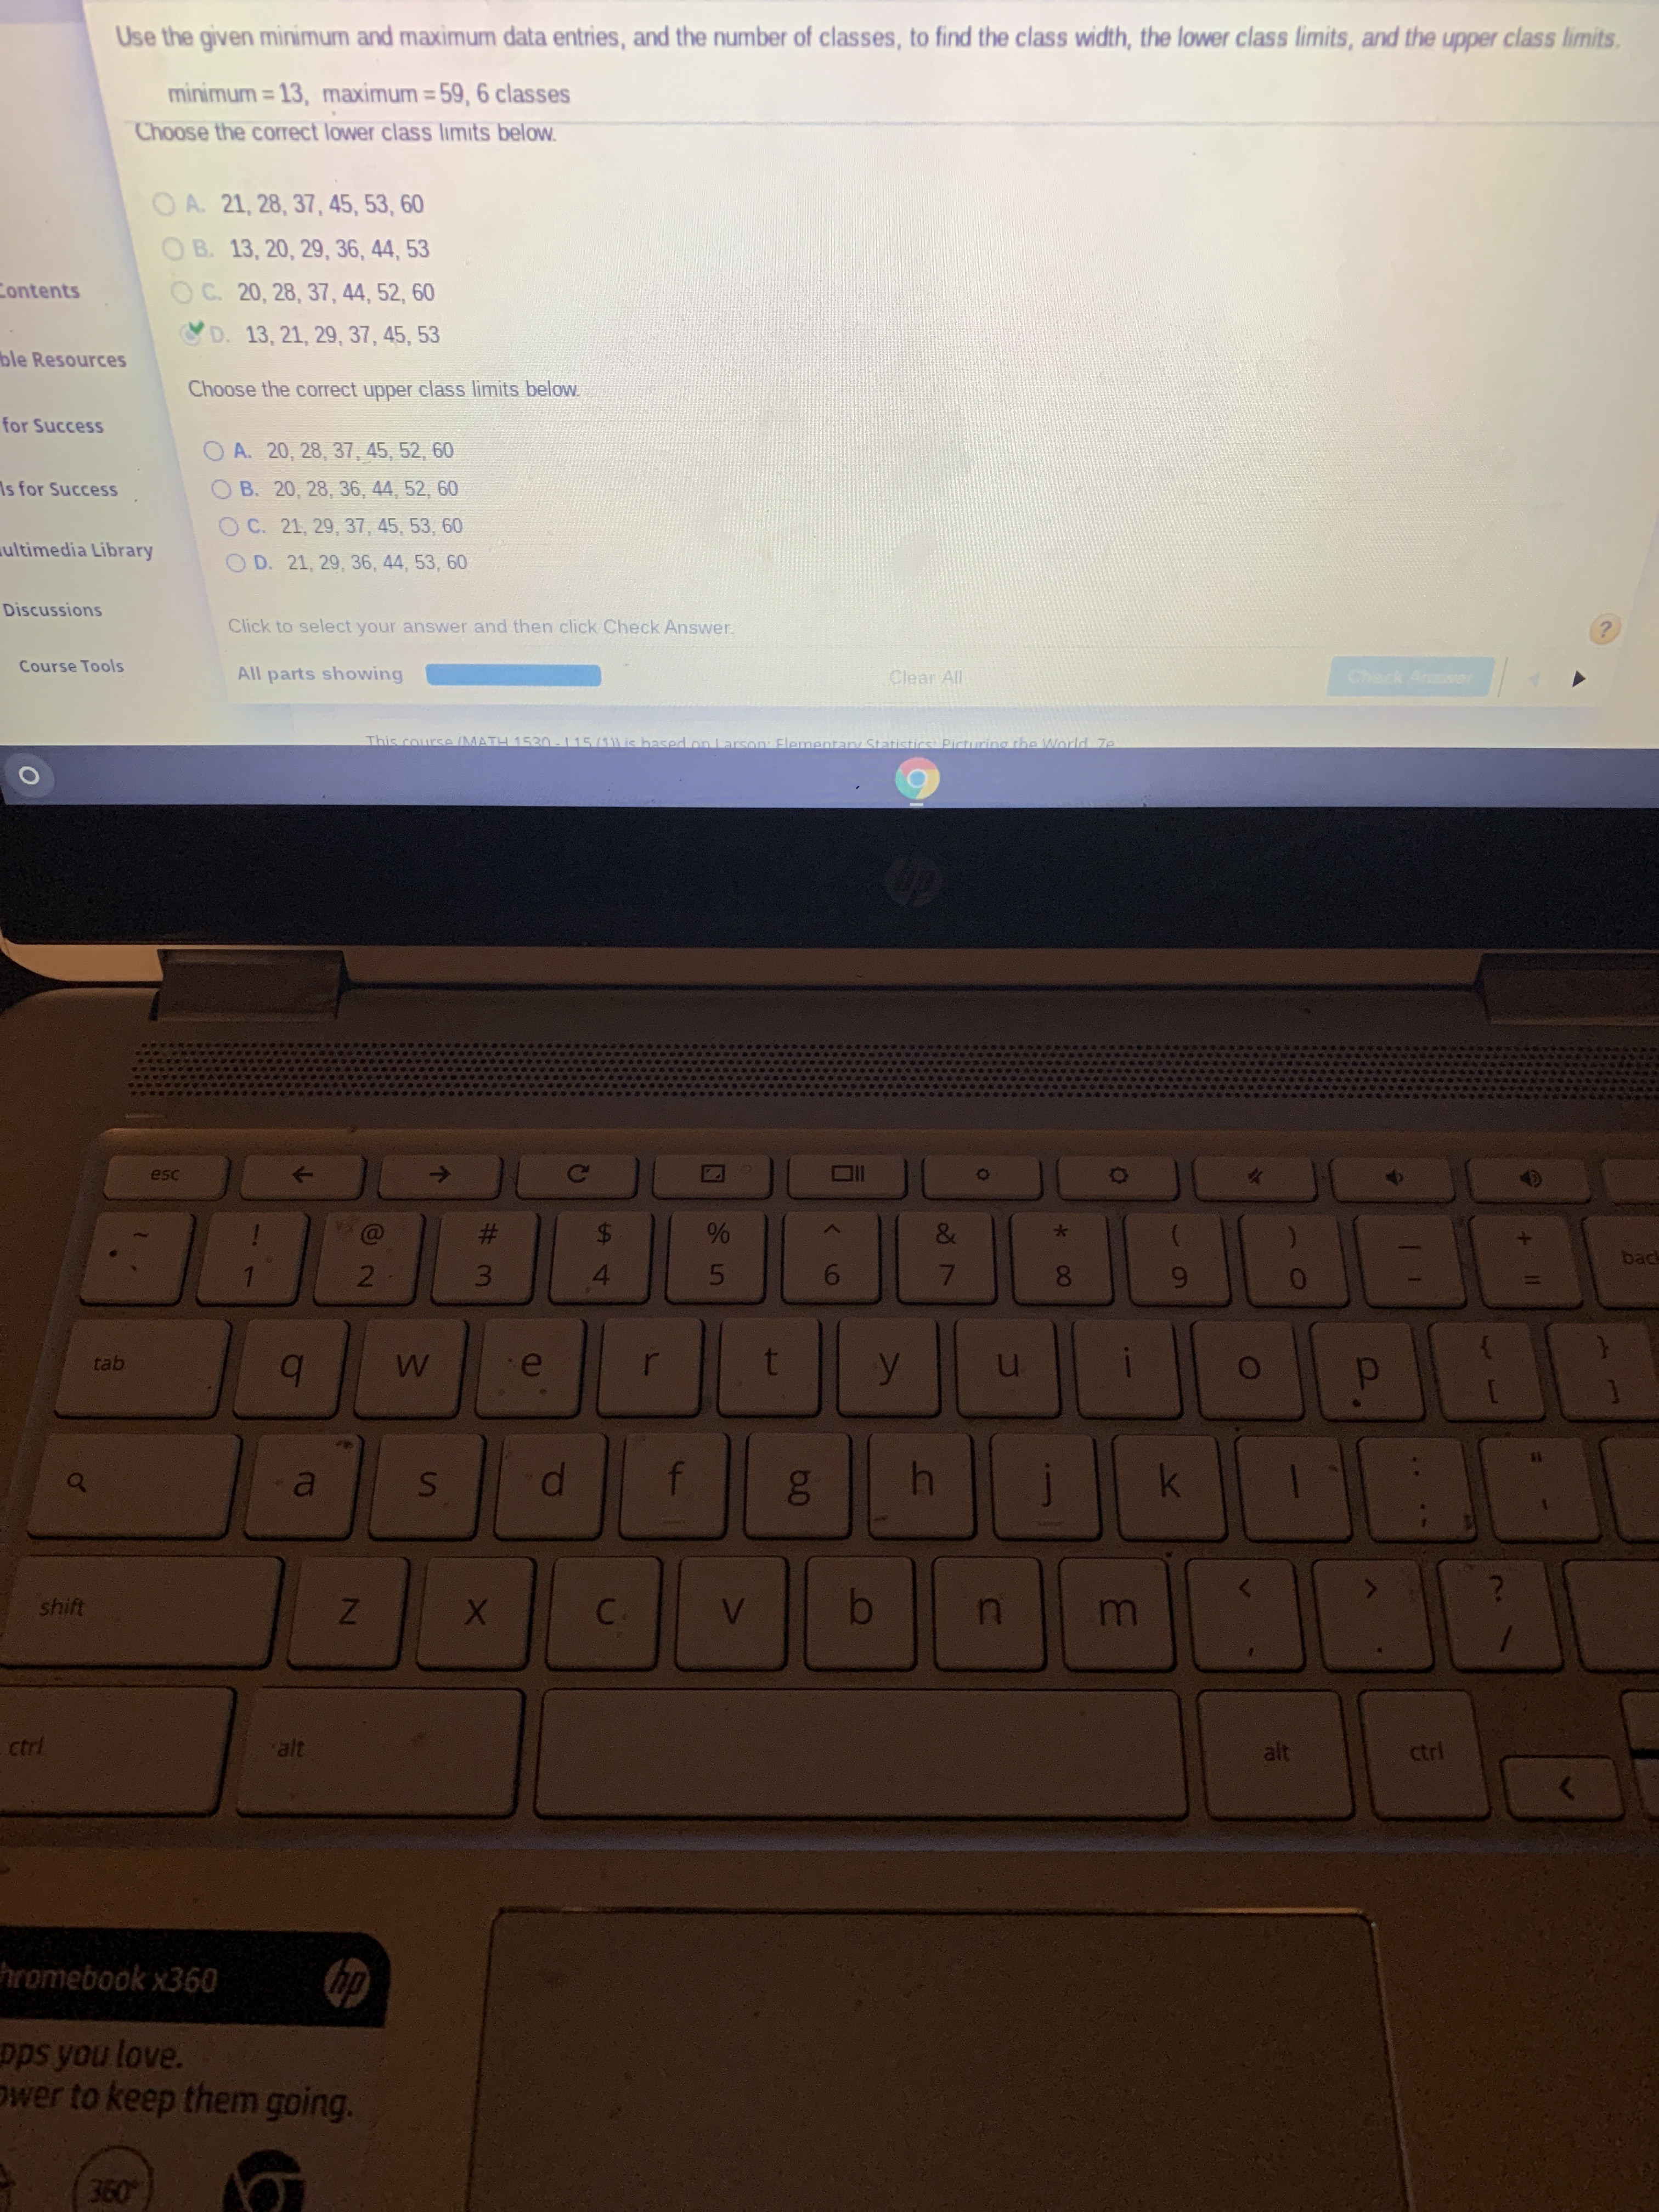

Transcribed Image Text:Use the given minimum and maximum data entries, and the number of classes, to find the class width, the lower class limits, and the upper class limits.
minimum = 13, maximum = 59, 6 classes
%3D
Choose the correct lower class limits below.
OA. 21, 28, 37, 45, 53, 60
O B. 13, 20, 29, 36, 44, 53
OC. 20, 28, 37, 44, 52, 60
D. 13, 21, 29, 37, 45, 53
rces
Choose the correct upper class limits below.
O A. 20, 28, 37, 45, 52, 60
O B. 20, 28, 36, 44, 52, 60
ess
OC. 21, 29, 37, 45, 53, 60
Library
O D. 21, 29, 36, 44, 53, 60
Expert Solution
This question has been solved!
Explore an expertly crafted, step-by-step solution for a thorough understanding of key concepts.

This is a popular solution

Trending nowThis is a popular solution!

Step by stepSolved in 3 steps with 2 images

Knowledge Booster


Learn more about
Need a deep-dive on the concept behind this application? Look no further. Learn more about this topic, statistics and related others by exploring similar questions and additional content below.Similar questions
- Servings Grams 1 11 2 15 3 23 4 29 5 19 6 22 7 21 8 20 9 15 10 25 11 17 complete a descriptive statistics and box-and-whiskers diagram in excel for the table.arrow_forwardresearcher would like to examine the effect of fertilizer on flower growth. She obtains several flowers. She randomly assigns half the plants to the no fertilizer condition. The other half of the plants receive fertilizer. She monitors their growth for a month. She then compares the amount of growth of the two sets of plants. Is there a difference in growth between the no fertilizer and the fertilizer conditions? Use the .05 level of significance. In addition, find Cohen’s d and state what the effect size is in a sentence. Growth Rating No Fertilizer 40,21,27,30, 47 Fertilizer 46,25, 24, 38, 53arrow_forward← Use the given minimum and maximum data entries, and the number of classes, to find the class width, the lower class limits, and the upper class limits. minimum = 8, maximum = 94, 6 classes The class width is Choose the correct lower class limits below. OA. 8, 23, 38, 53, 68, 83 OB. 23, 37, 53, 68, 83, 97 OC. 22, 37, 53, 67, 82, 97 OD. 8, 22, 38, 52, 67, 83 Choose the correct upper class limits below. OA. 22, 37, 52, 67, 82, 97 OB. 22, 37, 53, 68, 82, 97 OC. 23, 38, 53, 68, 83,97 OD. 23, 38, 52, 67, 83,97 IEEEarrow_forward
- With four quartiles pleasearrow_forwardThe mall has a set of data with employee age (X) and the corresponding number of annual on-the-job-accidents(Y). Analysis on the set finds that the regression equation is Y=100-3X. What is the likely number of accidents for someone aged 30? 97 100 10 none of the abovearrow_forwardWhich of these can help you visualize data? Select all that apply. O bank statement O circle graph O spreadsheet O table O bar grapharrow_forward
- 3. The number of goals scored by Wayne Gretzky was recorded for seasons 1978 – 1999. (Please note the data set has been ordered from smallest to the largest for your convenience). 5, 9, 11, 16, 23, 23, 31, 38, 40, 40, 41, 46, 51, 52, 54, 55, 62, 71, 73, 87, 92 A. Construct a stem-and-leaf display for the data and describe the shape of the distribution (symmetric, skewed left, skewed right, bell-shaped, etc., any obvious outliers). B. What is the fraction of the data that is less than or equal to 31? C. Given that Ex, = 920 and Ex = 52 436 find the mean and standard deviation. D. Find the (i) median, (ii) Q1, (iii)Q:, (iv) the interquartile range (IQR), (v) the lower and upper fences. E. Construct a Box-plot for the data. What are your conclusions about the shape of the distribution? Compare with the results in Part A. F. Would the mean or the median be the most suitable measure to use to represent the central location of this distribution? Give reasons for your answer.arrow_forwardYouTube G Create EStream You... e Left:1:15:25 Tahani Alala: Attempt 1 In a Pyramid lake, people go to catch really large cutthroat trout. The following table compares the data number of hours per fish caught fishing from the shore and number of hours per fish caught using a boat. The following data are paired by month from October through April. Oct. Nov. Dec. Jan. Feb. March April B: Shore 1.6 1.8 2.0 3.2 3.9 3.6 3.3 A: Boat 1.5 1.4 1.6 2.2 3.3 3.0 3.8 d3DB- A 0.1 0.4 0.4 1.0 0.6 -0.5 Use a 1% level of significance to test if there is a difference in population mean hours per fish caught using a boat compared with fishing from the shore. Given that d = 0.37 and Sd = 0.47. Solution: Step 1: Stating hypothesis: Null Hypothesis; = Pl : 0H 五 ily f7 f8 f12 61 DDI |44 * 6. 3. %3D 8. 1/2 1/4 3/4 >>arrow_forwardFor each vignette, choose the type of research that is being conducted. There is only one correct answer for each vignette. Here are your answer choices for questions 1-18 Case Study Naturalistic Observation Laboratory Observation Survey Correlation Test Experiment Longitudinal Design Cross Section Cross Sequential Design Maria wants to understand the political demographics in her community, so she creates a questionnaire asking people to identify their age, gender, political affiliation, religion and marital status. After Maria collects the abovementioned data (in question #12), she then identifies the relationships between religion and political affiliation. Kathi…arrow_forward
- Construct a dotplot for the given data. 1.2, 1.0, 0.8, 0.9, 0.8. 0.8, 1.1, 1.0, 2.1, 1.3, 0.9, 0.8, 0.8, 0.9, 0.9 L USE SALT 00.5 1.0 1.5 2.0 2.5 1.0 1.5 2.0 005 2.5 00.5 1.0 1.5 2.0 2.5 00.5 1.0 1.5 2.0 2.5 Describe the shape of the distribution and look for any outliers. O The data is skewed left with one unusually small outlier. O The data is skewed left with no obvious outliers. O The data is skewed right with one unusually large outlier O The data is mound shaped with no obvious outliers. O The data is mound shaped with one unusually smal and one unu usually large outlienarrow_forwardPlease see the picture below. I only am given one attempt at this problem.arrow_forward
arrow_back_ios
arrow_forward_ios
Recommended textbooks for you
- MATLAB: An Introduction with ApplicationsStatisticsISBN:9781119256830Author:Amos GilatPublisher:John Wiley & Sons Inc
 Probability and Statistics for Engineering and th...StatisticsISBN:9781305251809Author:Jay L. DevorePublisher:Cengage Learning
 Statistics for The Behavioral Sciences (MindTap C...StatisticsISBN:9781305504912Author:Frederick J Gravetter, Larry B. WallnauPublisher:Cengage Learning
  Elementary Statistics: Picturing the World (7th E...StatisticsISBN:9780134683416Author:Ron Larson, Betsy FarberPublisher:PEARSON
 The Basic Practice of StatisticsStatisticsISBN:9781319042578Author:David S. Moore, William I. Notz, Michael A. FlignerPublisher:W. H. Freeman
 Introduction to the Practice of StatisticsStatisticsISBN:9781319013387Author:David S. Moore, George P. McCabe, Bruce A. CraigPublisher:W. H. Freeman
MATLAB: An Introduction with Applications
Statistics
ISBN:9781119256830
Author:Amos Gilat
Publisher:John Wiley & Sons Inc
Probability and Statistics for Engineering and th...
Statistics
ISBN:9781305251809
Author:Jay L. Devore
Publisher:Cengage Learning
Statistics for The Behavioral Sciences (MindTap C...
Statistics
ISBN:9781305504912
Author:Frederick J Gravetter, Larry B. Wallnau
Publisher:Cengage Learning
Elementary Statistics: Picturing the World (7th E...
Statistics
ISBN:9780134683416
Author:Ron Larson, Betsy Farber
Publisher:PEARSON
The Basic Practice of Statistics
Statistics
ISBN:9781319042578
Author:David S. Moore, William I. Notz, Michael A. Fligner
Publisher:W. H. Freeman
Introduction to the Practice of Statistics
Statistics
ISBN:9781319013387
Author:David S. Moore, George P. McCabe, Bruce A. Craig
Publisher:W. H. Freeman