Driving would be more pleasant if we didn't have to put up with the bad habits of other drivers. A newspaper reported the results of a Valvoline Oil Company survey of 500 drivers in which the drivers marked their complaints about other drivers. The top complaints turned out to be tailgating, marked by 24% of the respondents; not using turn signals, marked by 20%; being cut off, marked by 13%; other drivers driving too slowly, marked by 10%; and other drivers being inconsiderate marked by 5%. (a) Make a Pareto chart showing percentage of drivers listing each stated complaint. (choose one of the options) (b) Could this information as reported be put in a circle graph? A. Since the percentages do not add to 100%, a circle graph cannot be used. If we create an "other" category and assume that all other respondents fit this category, then a circle could be created. B. Since the percentages add to 100%, a circle graph can be used. C. Since the categories overlap, a circle graph cannot be used. D. Since the percentages do not add to 100%, a circle graph cannot be used and there is no way to adjust the categories.
Driving would be more pleasant if we didn't have to put up with the bad habits of other drivers. A newspaper reported the results of a Valvoline Oil Company survey of 500 drivers in which the drivers marked their complaints about other drivers. The top complaints turned out to be tailgating, marked by 24% of the respondents; not using turn signals, marked by 20%; being cut off, marked by 13%; other drivers driving too slowly, marked by 10%; and other drivers being inconsiderate marked by 5%. (a) Make a Pareto chart showing percentage of drivers listing each stated complaint. (choose one of the options) (b) Could this information as reported be put in a circle graph? A. Since the percentages do not add to 100%, a circle graph cannot be used. If we create an "other" category and assume that all other respondents fit this category, then a circle could be created. B. Since the percentages add to 100%, a circle graph can be used. C. Since the categories overlap, a circle graph cannot be used. D. Since the percentages do not add to 100%, a circle graph cannot be used and there is no way to adjust the categories.

MATLAB: An Introduction with Applications
6th Edition
ISBN:9781119256830
Author:Amos Gilat
Publisher:Amos Gilat
Chapter1: Starting With Matlab
Section: Chapter Questions
Problem 1P

Related questions
Topic Video
Question
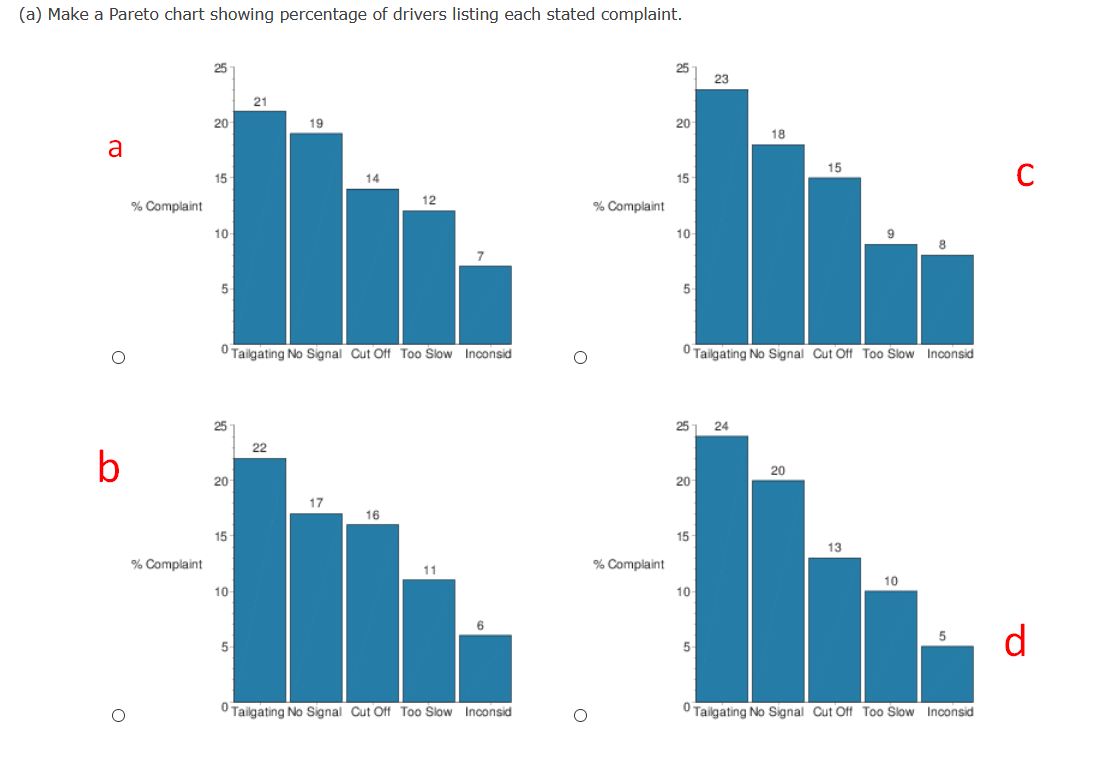
Driving would be more pleasant if we didn't have to put up with the bad habits of other drivers. A newspaper reported the results of a Valvoline Oil Company survey of 500 drivers in which the drivers marked their complaints about other drivers.
The top complaints turned out to be tailgating, marked by 24% of the respondents; not using turn signals, marked by 20%; being cut off, marked by 13%; other drivers driving too slowly, marked by 10%; and other drivers being inconsiderate marked by 5%.
(a) Make a Pareto chart showing percentage of drivers listing each stated complaint. (choose one of the options)
(b) Could this information as reported be put in a circle graph?
A. Since the percentages do not add to 100%, a circle graph cannot be used. If we create an "other" category and assume that all other respondents fit this category, then a circle could be created.
B. Since the percentages add to 100%, a circle graph can be used.
C. Since the categories overlap, a circle graph cannot be used.
D. Since the percentages do not add to 100%, a circle graph cannot be used and there is no way to adjust the categories.
Transcribed Image Text:(a) Make a Pareto chart showing percentage of drivers listing each stated complaint.
25
25
23
21
20
19
20
18
a
15
15
14
15
12
% Complaint
% Complaint
10
10
5-
O Tailgating No Signal Cut Off To0 Slow Inconsid
0 Tailgating No Signal Cut Off Too Slow Inconsid
25
251 24
22
b
20
20
20
17
16
15
15-
13
% Complaint
11
% Complaint
10
10
10
d
5-
5
O Tailgating No Signal Cut Off Too Slow Inconsid
0 Tailgating No Signal Cut Off To0 Šlow Inconsid
Expert Solution
This question has been solved!
Explore an expertly crafted, step-by-step solution for a thorough understanding of key concepts.

This is a popular solution!

Trending now
This is a popular solution!

Step by step
Solved in 2 steps

Knowledge Booster


Learn more about
Need a deep-dive on the concept behind this application? Look no further. Learn more about this topic, statistics and related others by exploring similar questions and additional content below.Recommended textbooks for you
MATLAB: An Introduction with Applications
Statistics
ISBN:
9781119256830
Author:
Amos Gilat
Publisher:
John Wiley & Sons Inc

Probability and Statistics for Engineering and th…
Statistics
ISBN:
9781305251809
Author:
Jay L. Devore
Publisher:
Cengage Learning

Statistics for The Behavioral Sciences (MindTap C…
Statistics
ISBN:
9781305504912
Author:
Frederick J Gravetter, Larry B. Wallnau
Publisher:
Cengage Learning
MATLAB: An Introduction with Applications
Statistics
ISBN:
9781119256830
Author:
Amos Gilat
Publisher:
John Wiley & Sons Inc
Probability and Statistics for Engineering and th…
Statistics
ISBN:
9781305251809
Author:
Jay L. Devore
Publisher:
Cengage Learning
Statistics for The Behavioral Sciences (MindTap C…
Statistics
ISBN:
9781305504912
Author:
Frederick J Gravetter, Larry B. Wallnau
Publisher:
Cengage Learning

Elementary Statistics: Picturing the World (7th E…
Statistics
ISBN:
9780134683416
Author:
Ron Larson, Betsy Farber
Publisher:
PEARSON

The Basic Practice of Statistics
Statistics
ISBN:
9781319042578
Author:
David S. Moore, William I. Notz, Michael A. Fligner
Publisher:
W. H. Freeman

Introduction to the Practice of Statistics
Statistics
ISBN:
9781319013387
Author:
David S. Moore, George P. McCabe, Bruce A. Craig
Publisher:
W. H. Freeman