Duration Amounts Absorbed 1.3 1 2 44 10 24 Source Duration 1.7 1.9 Error Total 2.2 2.0 1.9 2,5 1.6 2.2 2.5 (a) Gersteu Construct an ANOVA table. Round answers to four to four decimal places. your One-Way ANOVA table: Pesticide Amoun 1.7 1.3 2.5 207 1.6 DE 2.1 2.5 2,6 107 1.5 SS MS Ер
Duration Amounts Absorbed 1.3 1 2 44 10 24 Source Duration 1.7 1.9 Error Total 2.2 2.0 1.9 2,5 1.6 2.2 2.5 (a) Gersteu Construct an ANOVA table. Round answers to four to four decimal places. your One-Way ANOVA table: Pesticide Amoun 1.7 1.3 2.5 207 1.6 DE 2.1 2.5 2,6 107 1.5 SS MS Ер

College Algebra (MindTap Course List)
12th Edition
ISBN:9781305652231
Author:R. David Gustafson, Jeff Hughes
Publisher:R. David Gustafson, Jeff Hughes
Chapter8: Sequences, Series, And Probability
Section8.7: Probability
Problem 58E: What is meant by the sample space of an experiment?

Related questions
Question
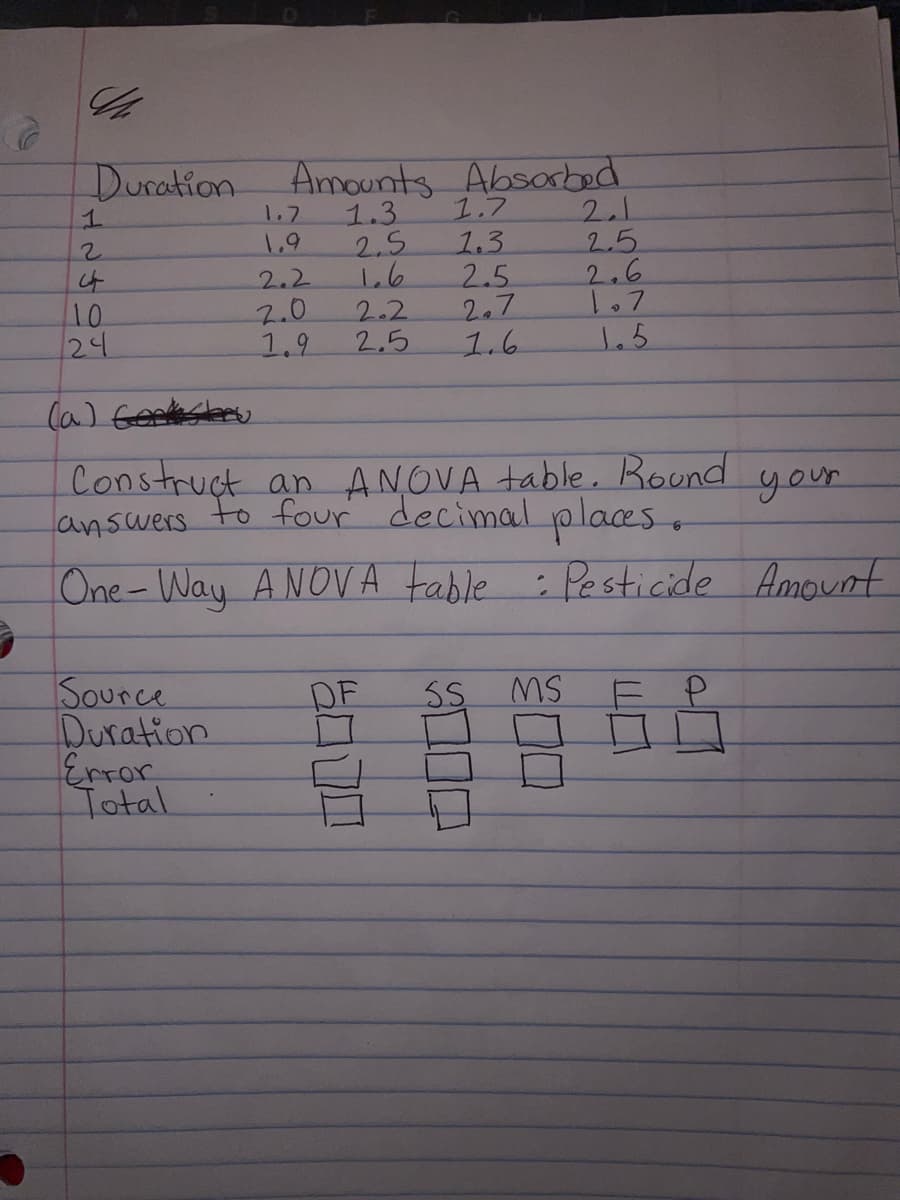
Pesticide danger: One of the factors that determines the degree of risk a pesticide poses to human health is the rate at which a pesticide is absorbed into skin after contact. An important question is whether the amount in the skin continues to increase with the length of the contact, or whether it increases for only a short time before leveling off. To investigate this, measured amounts of a certain pesticide were applied to 20 samples of rat skin. Four skins were analyzed at each of the time intervals 1, 2, 4, 10, and 24 hours. The amounts of the chemical (in micrograms) that were in the skin are given in the following table.
Transcribed Image Text:a
Duration Amounts Absorbed
1.3
1
2
나
10
24
Source
Duration
1.7
1,9
Error
Total
2.2
2.0
1.9
2,5
1.6
2.2
2.5
(a) Constru
Construct an ANOVA table. Round
to four decimal places.
answers
One-Way ANOVA table : Pesticide Amount
1.7
1.3
2.5
2,7
1.6
DE
2.1
2.5
2.6
107
1.5
SS MS
your
Expert Solution
This question has been solved!
Explore an expertly crafted, step-by-step solution for a thorough understanding of key concepts.

This is a popular solution!

Trending now
This is a popular solution!

Step by step
Solved in 4 steps with 20 images

Recommended textbooks for you
College Algebra (MindTap Course List)
Algebra
ISBN:
9781305652231
Author:
R. David Gustafson, Jeff Hughes
Publisher:
Cengage Learning
College Algebra (MindTap Course List)
Algebra
ISBN:
9781305652231
Author:
R. David Gustafson, Jeff Hughes
Publisher:
Cengage Learning