During the 2019 Masters Golf tournament Patrick Reed failed to repeat as champion. His scores relative to par in each round, on each hole are reported in the table. Hole Round 1 Round 2 Round 3 Round 4 -1 -1 -1 1 4 1 1. 1 6. 1. 8. 0. -1 9. 10 -1 1. 11 1. 1. 12 13 -2 -1 14 1 15 -1 -1 16 1. 17 -1 18
During the 2019 Masters Golf tournament Patrick Reed failed to repeat as champion. His scores relative to par in each round, on each hole are reported in the table. Hole Round 1 Round 2 Round 3 Round 4 -1 -1 -1 1 4 1 1. 1 6. 1. 8. 0. -1 9. 10 -1 1. 11 1. 1. 12 13 -2 -1 14 1 15 -1 -1 16 1. 17 -1 18

Practical Management Science
6th Edition
ISBN:9781337406659
Author:WINSTON, Wayne L.
Publisher:WINSTON, Wayne L.
Chapter7: Nonlinear Optimization Models
Section7.6: Models For Rating Sports Teams
Problem 31P

Related questions
Question
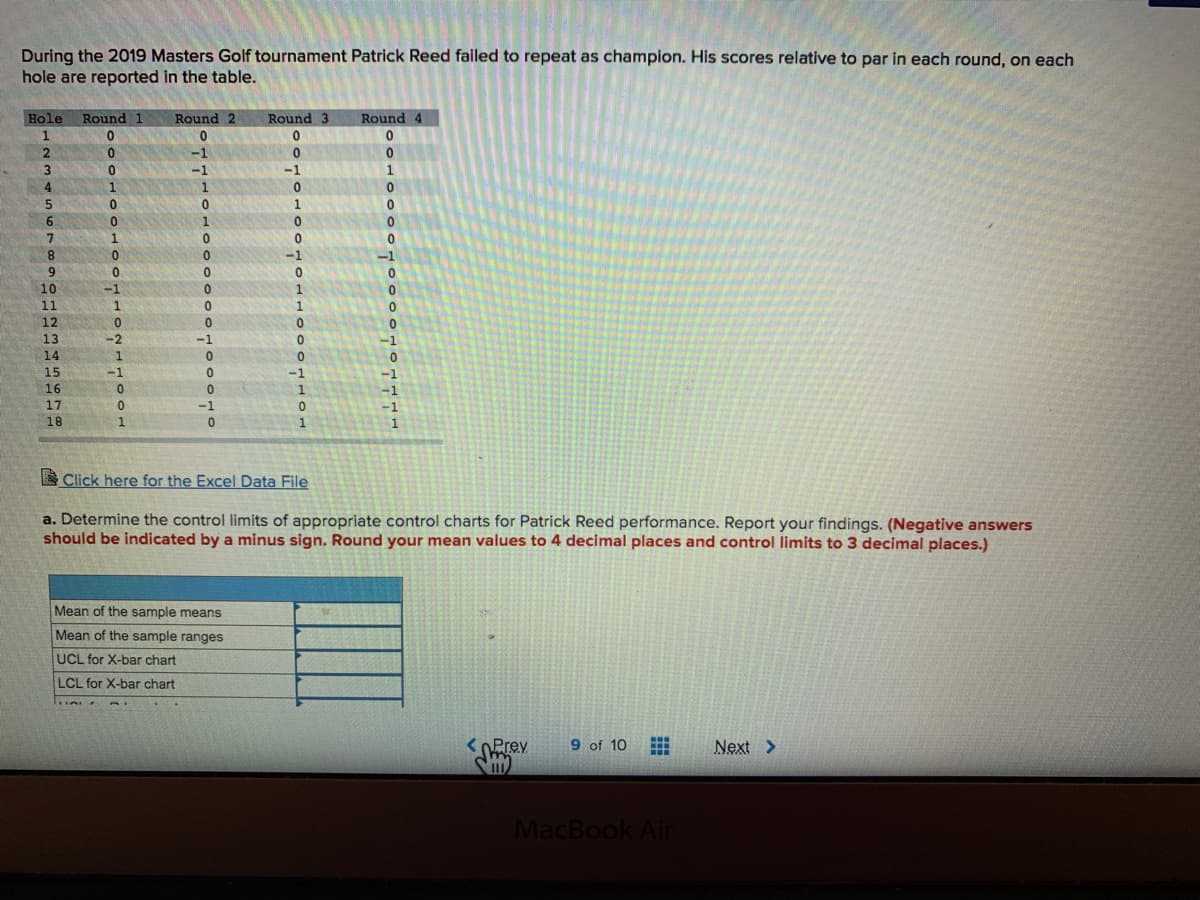
Transcribed Image Text:During the 2019 Masters Golf tournament Patrick Reed failed to repeat as champion. His scores relative to par in each round, on each
hole are reported in the table.
Hole
Round 1
Round 2
Round 3
Round 4
1
0.
2
3
-1
-1
4.
1
5.
1.
6.
7.
1.
0.
-1
-1
10
11
1.
1
12
0.
13
-2
-1
14
1.
15
-1
16
17
-1
18
E Click here for the Excel Data File
a. Determine the control limits of appropriate control charts for Patrick Reed performance. Report your findings. (Negative answers
should be indicated by a minus sign. Round your mean values to 4 decimal places and control limits to 3 decimal places.)
Mean of the sample means
Mean of the sample ranges
UCL for X-bar chart
LCL for X-bar chart
<OPrev
9 of 10
Next >
MacBook Air
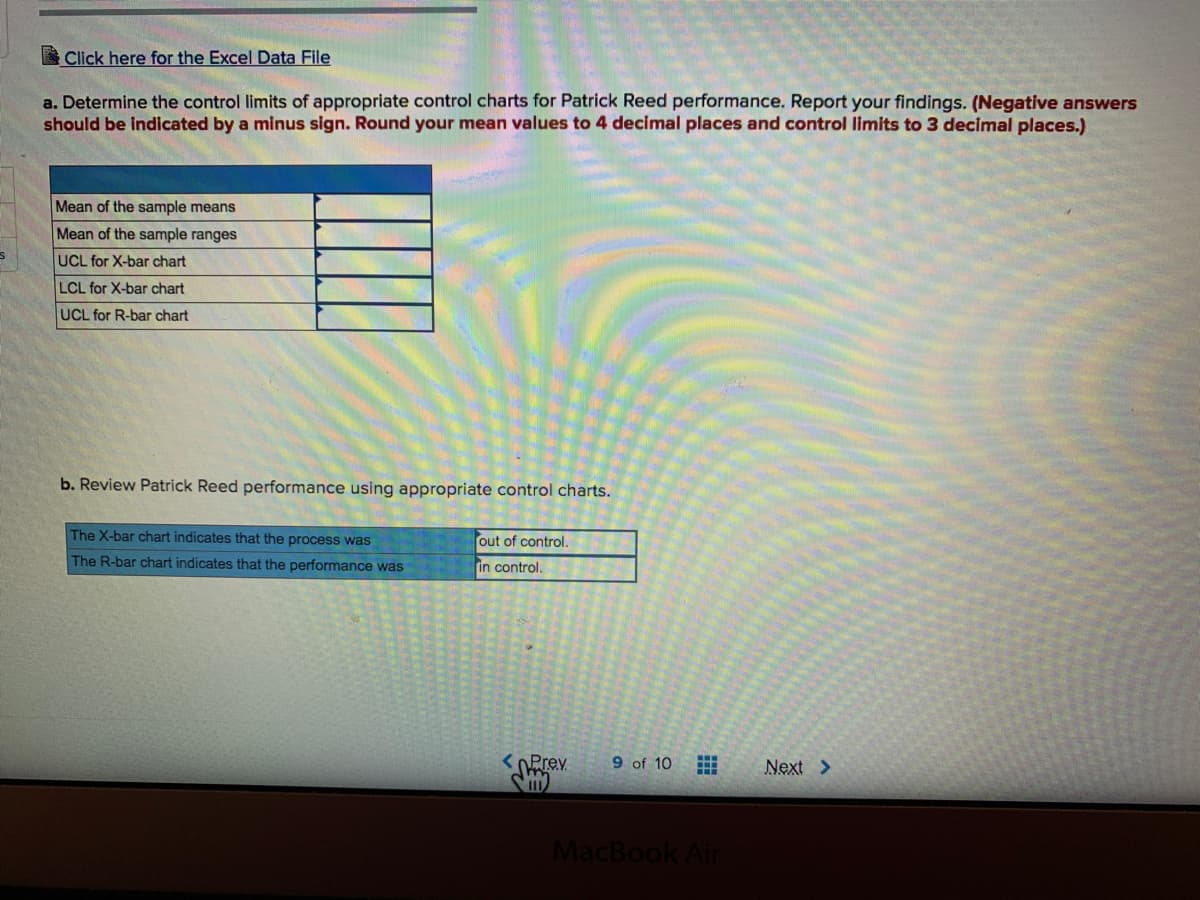
Transcribed Image Text:Click here for the Excel Data File
a. Determine the control limits of appropriate control charts for Patrick Reed performance. Report your findings. (Negative answers
should be indicated by a minus sign. Round your mean values to 4 decimal places and control limits to 3 decimal places.)
Mean of the sample means
Mean of the sample ranges
UCL for X-bar chart
LCL for X-bar chart
UCL for R-bar chart
b. Review Patrick Reed performance using appropriate control charts.
The X-bar chart indicates that the process was
out of control.
The R-bar chart indicates that the performance was
in control.
<OPrev
9 of 10
Next >
MacBook Air
Expert Solution
This question has been solved!
Explore an expertly crafted, step-by-step solution for a thorough understanding of key concepts.

This is a popular solution!

Trending now
This is a popular solution!

Step by step
Solved in 3 steps with 4 images

Knowledge Booster


Learn more about
Need a deep-dive on the concept behind this application? Look no further. Learn more about this topic, operations-management and related others by exploring similar questions and additional content below.Recommended textbooks for you
Practical Management Science
Operations Management
ISBN:
9781337406659
Author:
WINSTON, Wayne L.
Publisher:
Cengage,
Practical Management Science
Operations Management
ISBN:
9781337406659
Author:
WINSTON, Wayne L.
Publisher:
Cengage,