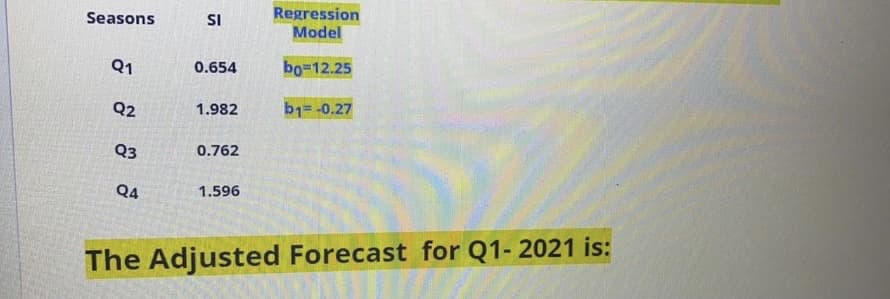
SI Regression Model Seasons Q1 0.654 bo=12.25 Q2 1.982 b1=-0.27 Q3 0.762 Q4 1.596 The Adjusted Forecast for Q1- 2021 is:


Q: Determine the forecast of next year’s quarterly sales revenue for this line of laptops. NOTE: For…
A: The seasonal data needs to be determined.
Q: Sales of tablet computers at Ted Glickman's electronics store in Washington, D.C., over the past 10…
A: Error = Actual - Forecast Absolute Error = Positive Difference of Actual Demand and Forecast…
Q: Two forecasting methods were used to forecast the next 12 quarters. The forecasts and actuals for…
A:
Q: The number of heart surgeries performed at Heartville General Hospital has increased steadily over…
A: Since you have submitted a question with multiple sub-parts as per guidelines we have answered the…
Q: Killian Corporation makes hot chocolate erly forecasts are in following Table. Year 2019 2020 2021…
A: Forecast for the sales for the spring of 2022 is calculated as, FS22 = 100+150+200÷3 = 150…
Q: In exponential smoothing, if ɑ = 0.3, then the damping factor for use in forecasting should be: *…
A: Exponential smoothing is a forecasting method which identify the forecasting value using the…
Q: Sales of tablet computers at Ted Glickman's electronics store in Washington, D.C., over the past 10…
A: Exponential Smoothing is a hugely familiar system to provide a smoothed time series. In the single…
Q: Sales of Volkswagen's popular Beetle have grown steadily at auto dealerships in Nevada during the…
A: Given data, Year Sales 1 455 2 510 3 518 4 570 5 590
Q: Café Michigan's manager, Gary Stark, suspects that demand for mocha latte coffees depends on the…
A:
Q: Sales of Volkswagen's popular Beetle have grown steadily at auto dealerships in Nevada during the…
A:
Q: Period 1 2 3 4 6. 7 8 9 10 11 12 Sales 568 604 645 742 661 606 749 680 704 736 660 756
A:
Q: The demand (in number of units) for Apple iPad over the past 6 months at BestBuy is summarized…
A: 2-month weighted moving average: Formula: Answer:
Q: The manager wants to forecast the month 6's sales using the following historical data: Months Month…
A: Forecasting is the process of estimating the future demand using the previous years information and…
Q: A police station had to deploy a police officer for an emergency multiple times in the last four…
A: Naive forecasting is an forecast estimation technique in which the current period forecast is equal…
Q: Forecasts are usually classified by time horizon into three categories a. finance/accounting,…
A: Forecasts are usually classified by time horizon into three categories finance/accounting,…
Q: A manufacturer of printed circuit boards uses exponentialsmoothing with trend to forecast monthly…
A: The image given in step 2 gives a detailed solution of the question that has been asked.
Q: Can you help me with figuring out how to do find the correct solution? Other instructions were not…
A: Step1: Calculating the average total demand of four seasons for last four years. We have,The formula…
Q: The following tabulations are actual sales of units for six months and a starting forecast in…
A:
Q: Consider the following time series. t 1 2 3 4 5 yt 6 11 9 14 15 (a) Choose the correct…
A:
Q: Sales of Volkswagen's popular Beetle have grown steadily at auto dealerships in Nevada during the…
A:
Q: Sales of tablet computers at Ted Glickman's electronics store in Washington, D.C., over the past…
A: A) Formulae used : Forecast = (1 - smoothing factor) * Most recent period forecast) + (Smoothing…
Q: We are predicting quarterly sales for soda at Gordon’sLiquor Store using Winter’s method. We are…
A:
Q: Two different forecasting techniques (F1 and F2) were used to forecast demand for cases of bottled…
A: Mean Absolute Deviation (MAD) is one of the measures used to summarize historical errors in…
Q: A coffee shop owner wants to estimate demand for the next four quarters for hot chocolate. Sales…
A: Given, Quarter 1- 1.20 Quarter 2- 1.15 Quarter 3- 0.77 Quarter 4- 0.88
Q: Create a line graph for this set of monthly sales numbers. Run a regression analysis. What is…
A: Given data, For the above table data, we would construct a line graph, we would also run the…
Q: forecasting methods across different data sets?
A: Calculating the accuracy of a Forecasting method is focusing to choose the best forecasting method…
Q: Dr. Lillian Fok, a New Orleans psychologist, spe-cializes in treating patients who are agoraphobic…
A: Yc = a +bxb = n(∑xy) - (∑x)(∑y)n(∑x2) - (∑x2)a = ∑y - b∑xn or, y -bxYc = computed value of…
Q: The following are sales revenues for a large utility company for years 1 through 11. Forecast…
A: Year ( X ) REVENUE ( Y ) XY X2 1 4875.0 4875 1 2 5065.7 10131.4 4 3 5523.4 16570.2 9…
Q: The monthly demand for units manufactured by the Acme Rocket Company has been as follows:Month…
A:
Q: YEAR 2010 2011 2012 2013 2014 2015 2016 2017 2018 2019 ARRIVAL ('000) 35.5 28 30.3 36 49.5 56 72.4…
A: Given information, Year Delayed Rate Arrival X Y 2010 4.2 35.5 2011 3.8 28.00 2012…
Q: A police station had to deploy a police officer for an emergency multiple times in the last four…
A: Moving Average Method: Moving average is an uncomplicated, technical examination method. Moving…
Q: A convenience store recently started to carry a new brand of soft drink. Management is interested in…
A: Given data is
Q: discuss
A: The answer to this question is false.
Q: The manager of a utility company in the Texas panhandle wants to develop quarterly forecasts of…
A: Seasonal index = season demand / average yearly demand Seasonal index when multiple periods are…
Q: he Yummy Ice Cream Company projects the demand for ice cream by using first-order exponential…
A: 1.
Q: How does the linear trend line forecasting model differ from a lincar regression model for…
A: Linear trend line forecasting refers to the statistical tool that helps in better interpretation of…
Q: The following table gives the number of pints of type A blood used at Damascus Hospital in the past…
A: A. Forecasted demand for the week of October 12 using a 3-week moving average method =Pints used for…
Q: Mark Gershon, owner of a musical instrument distributorship, thinks that demand for guitars may be…
A:
Q: The number of heart surgeries performed at Heartville General Hospital has increased steadily over…
A: Since you have submitted a question with multiple sub-parts as per guidelines we have answered the…
Q: The number of auto accidents in Athens, Ohio is related to the regional number of regisgtered…
A: Given values: Regression formula; y=a+b1X1+b2x2+b3X3 where, Y = number of automobile accidents a =…
Q: The manager of a utility company in the Texas panhandle wants to develop quarterly forecasts of…
A:
Q: As you can see in the following table, demand for heart transplant surgery at Washington General…
A: The concept used here is forecasting with the Exponential Smoothening method.
Q: The following data relate the sales figures of the bar in Mark Kaltenbach's small bed-and-breakfast…
A: Given, 1 16 320 2 12 265 3 18 375 4 14 300
Q: Trinity General Hospital had the following number of patient admissions during the past 8 weeks Week…
A: Find the Given details below: Given details: Week Patient Admissions 1 120 2 145 3 95 4…
Q: a Compute MAD for the results of each forecasting method. Which one is more accurate? b Compute MSE…
A: Forecasting is a technique used to predict future outcomes on the basis of past data. In businesses…
Q: The last-value forecasting method: a. is quick and easy to prepare. b. is easy for users to…
A: A strategy that uses previous data as inputs to make well-informed predictions about the direction…
Q: The equation y = 210 + 3x is used to predict quarterly demand where x = 0 in the second quarter of…
A: Calculating the forecast for the third quarter of the year. We have,Y = 210 + 3xHere,x = Third…


Step by step
Solved in 2 steps


- The Baker Company wants to develop a budget to predict how overhead costs vary with activity levels. Management is trying to decide whether direct labor hours (DLH) or units produced is the better measure of activity for the firm. Monthly data for the preceding 24 months appear in the file P13_40.xlsx. Use regression analysis to determine which measure, DLH or Units (or both), should be used for the budget. How would the regression equation be used to obtain the budget for the firms overhead costs?A small computer chip manufacturer wants to forecast monthly ozperating costs as a function of the number of units produced during a month. The company has collected the 16 months of data in the file P13_34.xlsx. a. Determine an equation that can be used to predict monthly production costs from units produced. Are there any outliers? b. How could the regression line obtained in part a be used to determine whether the company was efficient or inefficient during any particular month?The file P13_02.xlsx contains five years of monthly data on sales (number of units sold) for a particular company. The company suspects that except for random noise, its sales are growing by a constant percentage each month and will continue to do so for at least the near future. a. Explain briefly whether the plot of the series visually supports the companys suspicion. b. By what percentage are sales increasing each month? c. What is the MAPE for the forecast model in part b? In words, what does it measure? Considering its magnitude, does the model seem to be doing a good job? d. In words, how does the model make forecasts for future months? Specifically, given the forecast value for the last month in the data set, what simple arithmetic could you use to obtain forecasts for the next few months?
- Do the sales prices of houses in a given community vary systematically with their sizes (as measured in square feet)? Answer this question by estimating a simple regression equation where the sales price of the house is the dependent variable, and the size of the house is the explanatory variable. Use the sample data given in P13_06.xlsx. Interpret your estimated equation, the associated R-square value, and the associated standard error of estimate.The file P13_42.xlsx contains monthly data on consumer revolving credit (in millions of dollars) through credit unions. a. Use these data to forecast consumer revolving credit through credit unions for the next 12 months. Do it in two ways. First, fit an exponential trend to the series. Second, use Holts method with optimized smoothing constants. b. Which of these two methods appears to provide the best forecasts? Answer by comparing their MAPE values.The file P13_26.xlsx contains the monthly number of airline tickets sold by the CareFree Travel Agency. a. Create a time series chart of the data. Based on what you see, which of the exponential smoothing models do you think will provide the best forecasting model? Why? b. Use simple exponential smoothing to forecast these data, using a smoothing constant of 0.1. c. Repeat part b, but search for the smoothing constant that makes RMSE as small as possible. Does it make much of an improvement over the model in part b?
- Suppose that a regional express delivery service company wants to estimate the cost of shipping a package (Y) as a function of cargo type, where cargo type includes the following possibilities: fragile, semifragile, and durable. Costs for 15 randomly chosen packages of approximately the same weight and same distance shipped, but of different cargo types, are provided in the file P13_16.xlsx. a. Estimate a regression equation using the given sample data, and interpret the estimated regression coefficients. b. According to the estimated regression equation, which cargo type is the most costly to ship? Which cargo type is the least costly to ship? c. How well does the estimated equation fit the given sample data? How might the fit be improved? d. Given the estimated regression equation, predict the cost of shipping a package with semifragile cargo.The file P13_29.xlsx contains monthly time series data for total U.S. retail sales of building materials (which includes retail sales of building materials, hardware and garden supply stores, and mobile home dealers). a. Is seasonality present in these data? If so, characterize the seasonality pattern. b. Use Winters method to forecast this series with smoothing constants = = 0.1 and = 0.3. Does the forecast series seem to track the seasonal pattern well? What are your forecasts for the next 12 months?The file P13_28.xlsx contains monthly retail sales of U.S. liquor stores. a. Is seasonality present in these data? If so, characterize the seasonality pattern. b. Use Winters method to forecast this series with smoothing constants = = 0.1 and = 0.3. Does the forecast series seem to track the seasonal pattern well? What are your forecasts for the next 12 months?
- The file P13_22.xlsx contains total monthly U.S. retail sales data. While holding out the final six months of observations for validation purposes, use the method of moving averages with a carefully chosen span to forecast U.S. retail sales in the next year. Comment on the performance of your model. What makes this time series more challenging to forecast?The management of a technology company is trying to determine the variable that best explains the variation of employee salaries using a sample of 52 full-time employees; see the file P13_08.xlsx. Estimate simple linear regression equations to identify which of the following has the strongest linear relationship with annual salary: the employees gender, age, number of years of relevant work experience prior to employment at the company, number of years of employment at the company, or number of years of post secondary education. Provide support for your conclusion.Stock market analysts are continually looking for reliable predictors of stock prices. Consider the problem of modeling the price per share of electric utility stocks (Y). Two variables thought to influence this stock price are return on average equity (X1) and annual dividend rate (X2). The stock price, returns on equity, and dividend rates on a randomly selected day for 16 electric utility stocks are provided in the file P13_15.xlsx. Estimate a multiple regression equation using the given data. Interpret each of the estimated regression coefficients. Also, interpret the standard error of estimate and the R-square value for these data.
