e graph input toal, change the number found in the Quantity Demanded fieid to determine the prices that correspond to the production af a 2. 24, 32, and 40 units of output Calcuiate the total revenue for cach of these production leveis. Then, on the fallowing grapih, use the gred (triangie symbal) to piot the results. Tuta Revenue 000 400
e graph input toal, change the number found in the Quantity Demanded fieid to determine the prices that correspond to the production af a 2. 24, 32, and 40 units of output Calcuiate the total revenue for cach of these production leveis. Then, on the fallowing grapih, use the gred (triangie symbal) to piot the results. Tuta Revenue 000 400

Chapter13: Monopoly And Antitrust
Section: Chapter Questions
Problem 13P

Related questions
Question
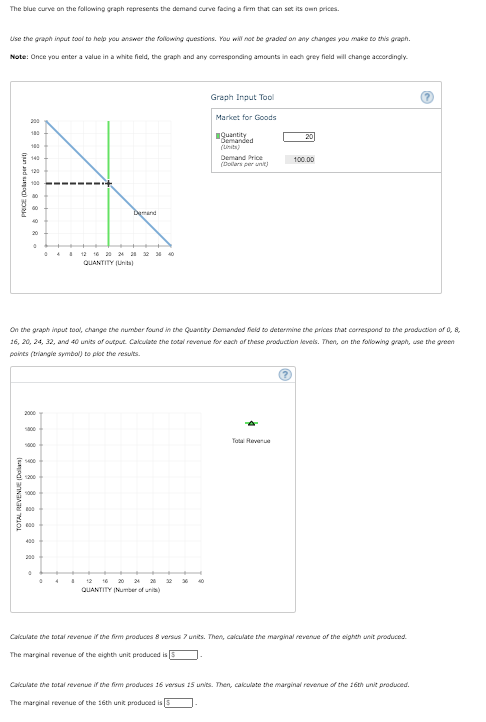
Transcribed Image Text:The blue curve on the fallowing graph represents the demand curve facing a firm that can set its own prices.
Use the graph inout tool to help you answer the folowing questions. You will not be graded on any changes you make to this graph.
Note: Once you enter a value in a white fidld, the graph and any corresponding amounts in cach grey field will change accordingly.
Graph Input Tool
Market for Goods
200
nguantity
Semanded
20
100
Demand Price
(Dolars per unt)
140
100.00
120
100
Demand
40
20
12 16 20 24 21 2 M 40
QUANTITY Iunita)
On the graph inpue tool, change the number found in the Quantity Demanded feld to determine the prices that correspond to the production of 0, 8,
26, 20, 24, 32, and 40 units of output Calculate the total revenue for each of these production leveis. Then, on the fallowing graph, use the green
paints (triangie symbal) to plot the resuuts.
2000
Tata Revenue
200
00
400
200
16 20
QUANTITY (Number of uni)
12
24
20
40
Calculate the total revenue if the firm produces 8 versus 7 units. Then, calculate the marginal revenue of the eighth unit produced.
The marginal revenue of the eighth unit produced is
Calculate the total revenue if the firm produces 16 versus 15 units. Then, calculate the marginal revenue of the 16th unit produced.
The marginal revenue of the 16th unit produced is 5
Gun ad suog 20
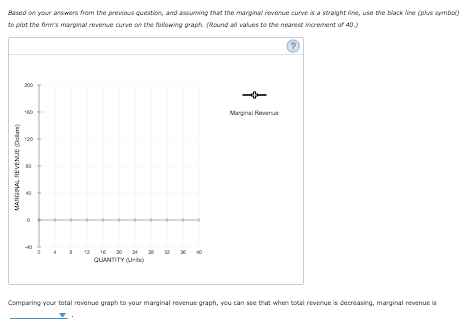
Transcribed Image Text:Based on your answers from the previous question, and assuming that the marginal reverue curve is a straignt ine, use the black Nine (plus symbol)
to piot the firm's marginal revenue curve on the fallowing graph. (Round al values to the nearest increment of 40.)
200
160
Marginal Forverue
120
! 12 16 20 * 2* 2 x 0
QUANTITY (Unts)
Comparing your total revenue graph to your marginal revenue graph, you can see that when total revenue is decreasing, marginal revenue is
MARGINAL REVENUE (Dolars)
Expert Solution
This question has been solved!
Explore an expertly crafted, step-by-step solution for a thorough understanding of key concepts.

This is a popular solution!

Trending now
This is a popular solution!

Step by step
Solved in 3 steps with 2 images

Knowledge Booster


Learn more about
Need a deep-dive on the concept behind this application? Look no further. Learn more about this topic, economics and related others by exploring similar questions and additional content below.Recommended textbooks for you
Exploring Economics
Economics
ISBN:
9781544336329
Author:
Robert L. Sexton
Publisher:
SAGE Publications, Inc

Principles of Economics 2e
Economics
ISBN:
9781947172364
Author:
Steven A. Greenlaw; David Shapiro
Publisher:
OpenStax

Exploring Economics
Economics
ISBN:
9781544336329
Author:
Robert L. Sexton
Publisher:
SAGE Publications, Inc
Principles of Economics 2e
Economics
ISBN:
9781947172364
Author:
Steven A. Greenlaw; David Shapiro
Publisher:
OpenStax

Economics: Private and Public Choice (MindTap Cou…
Economics
ISBN:
9781305506725
Author:
James D. Gwartney, Richard L. Stroup, Russell S. Sobel, David A. Macpherson
Publisher:
Cengage Learning

Microeconomics: Private and Public Choice (MindTa…
Economics
ISBN:
9781305506893
Author:
James D. Gwartney, Richard L. Stroup, Russell S. Sobel, David A. Macpherson
Publisher:
Cengage Learning

Principles of Macroeconomics (MindTap Course List)
Economics
ISBN:
9781305971509
Author:
N. Gregory Mankiw
Publisher:
Cengage Learning