E Question Help na study of the accuracy of fast food drive-through orders, Restaurant A had 297 accurate orders and 60 that were not accurate. a. Construct a 90% confidence interval estimate of the percentage of orders that are not accurate. p. Compare the results from part (a) to this 90% confidence interval for the percentage of orders that are not accurate at Restaurant B: 0.157
E Question Help na study of the accuracy of fast food drive-through orders, Restaurant A had 297 accurate orders and 60 that were not accurate. a. Construct a 90% confidence interval estimate of the percentage of orders that are not accurate. p. Compare the results from part (a) to this 90% confidence interval for the percentage of orders that are not accurate at Restaurant B: 0.157

MATLAB: An Introduction with Applications
6th Edition
ISBN:9781119256830
Author:Amos Gilat
Publisher:Amos Gilat
Chapter1: Starting With Matlab
Section: Chapter Questions
Problem 1P

Related questions

Topic Video
Question
Transcribed Image Text:Question Help
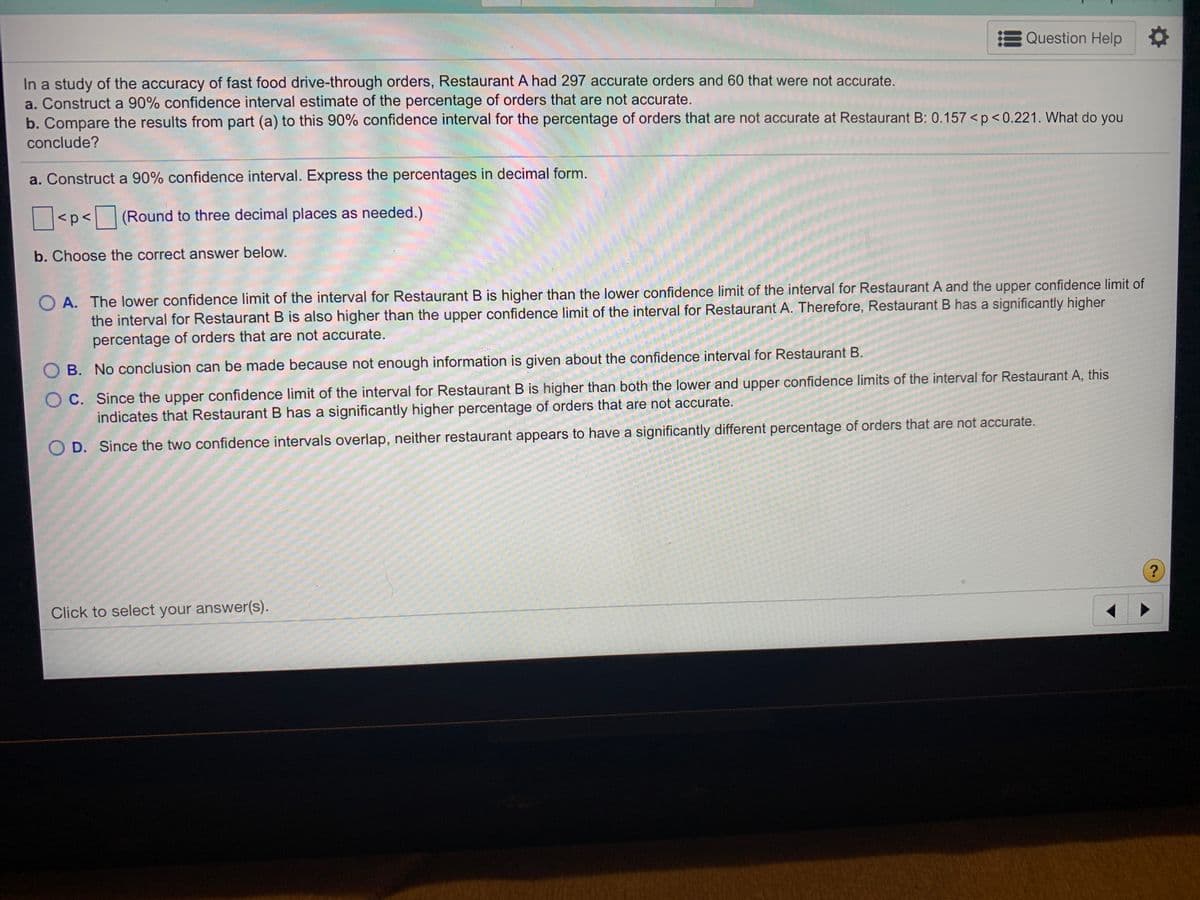
In a study of the accuracy of fast food drive-through orders, Restaurant A had 297 accurate orders and 60 that were not accurate.
a. Construct a 90% confidence interval estimate of the percentage of orders that are not accurate.
b. Compare the results from part (a) to this 90% confidence interval for the percentage of orders that are not accurate at Restaurant B: 0.157 <p<0.221. What do you
conclude?
a. Construct a 90% confidence interval. Express the percentages in decimal form.
|<p<
(Round to three decimal places as needed.)
b. Choose the correct answer below.
O A. The lower confidence limit of the interval for Restaurant B is higher than the lower confidence limit of the interval for Restaurant A and the upper confidence limit of
the interval for Restaurant B is also higher than the upper confidence limit of the interval for Restaurant A. Therefore, Restaurant B has a significantly higher
percentage of orders that are not accurate.
B. No conclusion can be made because not enough information is given about the confidence interval for Restaurant B.
O C. Since the upper confidence limit of the interval for Restaurant B is higher than both the lower and upper confidence limits of the interval for Restaurant A, this
indicates that Restaurant B has a significantly higher percentage of orders that are not accurate.
O D. Since the two confidence intervals overlap, neither restaurant appears to have a significantly different percentage of orders that are not accurate.
Click to select your answer(s).
Expert Solution
This question has been solved!
Explore an expertly crafted, step-by-step solution for a thorough understanding of key concepts.

This is a popular solution!

Trending now
This is a popular solution!

Step by step
Solved in 3 steps with 2 images

Knowledge Booster


Learn more about
Need a deep-dive on the concept behind this application? Look no further. Learn more about this topic, statistics and related others by exploring similar questions and additional content below.Recommended textbooks for you
MATLAB: An Introduction with Applications
Statistics
ISBN:
9781119256830
Author:
Amos Gilat
Publisher:
John Wiley & Sons Inc

Probability and Statistics for Engineering and th…
Statistics
ISBN:
9781305251809
Author:
Jay L. Devore
Publisher:
Cengage Learning

Statistics for The Behavioral Sciences (MindTap C…
Statistics
ISBN:
9781305504912
Author:
Frederick J Gravetter, Larry B. Wallnau
Publisher:
Cengage Learning
MATLAB: An Introduction with Applications
Statistics
ISBN:
9781119256830
Author:
Amos Gilat
Publisher:
John Wiley & Sons Inc
Probability and Statistics for Engineering and th…
Statistics
ISBN:
9781305251809
Author:
Jay L. Devore
Publisher:
Cengage Learning
Statistics for The Behavioral Sciences (MindTap C…
Statistics
ISBN:
9781305504912
Author:
Frederick J Gravetter, Larry B. Wallnau
Publisher:
Cengage Learning

Elementary Statistics: Picturing the World (7th E…
Statistics
ISBN:
9780134683416
Author:
Ron Larson, Betsy Farber
Publisher:
PEARSON

The Basic Practice of Statistics
Statistics
ISBN:
9781319042578
Author:
David S. Moore, William I. Notz, Michael A. Fligner
Publisher:
W. H. Freeman

Introduction to the Practice of Statistics
Statistics
ISBN:
9781319013387
Author:
David S. Moore, George P. McCabe, Bruce A. Craig
Publisher:
W. H. Freeman