In a study of the accuracy of fast food drive-through orders, Restaurant A had 226 accurate orders and 59 that were not accurate. a. Construct a 90% confidence interval estimate of the percentage of orders that are not accurate. b. Compare the results from part (a) to this 90% confidence interval for the percentage of orders that are not accurate at Restaurant B: 0.189
In a study of the accuracy of fast food drive-through orders, Restaurant A had 226 accurate orders and 59 that were not accurate. a. Construct a 90% confidence interval estimate of the percentage of orders that are not accurate. b. Compare the results from part (a) to this 90% confidence interval for the percentage of orders that are not accurate at Restaurant B: 0.189

Glencoe Algebra 1, Student Edition, 9780079039897, 0079039898, 2018
18th Edition
ISBN:9780079039897
Author:Carter
Publisher:Carter
Chapter4: Equations Of Linear Functions
Section: Chapter Questions
Problem 8SGR

Related questions
Topic Video
Question
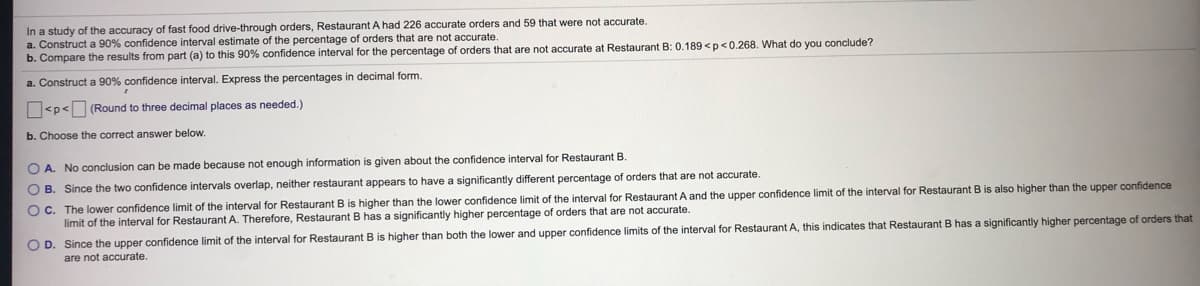
Transcribed Image Text:In a study of the accuracy of fast food drive-through orders, Restaurant A had 226 accurate orders and 59 that were not accurate.
a. Construct a 90% confidence interval estimate of the percentage of orders that are not accurate.
b. Compare the results from part (a) to this 90% confidence interval for the percentage of orders that are not accurate at Restaurant B: 0.189 <p<0.268. What do you conclude?
a. Construct a 90% confidence interval. Express the percentages in decimal form.
<p< (Round to three decimal places as needed.)
b. Choose the correct answer below.
O A. No conclusion can be made because not enough information is given about the confidence interval for Restaurant B.
O B. Since the two confidence intervals overlap, neither restaurant appears to have a significantly different percentage of orders that are not accurate.
O C. The lower confidence limit of the interval for Restaurant B is higher than the lower confidence limit of the interval for Restaurant A and the upper confidence limit of the interval for Restaurant B is also higher than the upper confidence
limit of the interval for Restaurant A. Therefore, Restaurant B has a significantly higher percentage of orders that are not accurate.
O D. Since the upper confidence limit of the interval for Restaurant B is higher than both the lower and upper confidence limits of the interval for Restaurant A, this indicates that Restaurant B has a significantly higher percentage of orders that
are not accurate.
Expert Solution
This question has been solved!
Explore an expertly crafted, step-by-step solution for a thorough understanding of key concepts.

This is a popular solution!

Trending now
This is a popular solution!

Step by step
Solved in 2 steps

Knowledge Booster


Learn more about
Need a deep-dive on the concept behind this application? Look no further. Learn more about this topic, statistics and related others by exploring similar questions and additional content below.Recommended textbooks for you
Glencoe Algebra 1, Student Edition, 9780079039897…
Algebra
ISBN:
9780079039897
Author:
Carter
Publisher:
McGraw Hill

College Algebra (MindTap Course List)
Algebra
ISBN:
9781305652231
Author:
R. David Gustafson, Jeff Hughes
Publisher:
Cengage Learning
Glencoe Algebra 1, Student Edition, 9780079039897…
Algebra
ISBN:
9780079039897
Author:
Carter
Publisher:
McGraw Hill
College Algebra (MindTap Course List)
Algebra
ISBN:
9781305652231
Author:
R. David Gustafson, Jeff Hughes
Publisher:
Cengage Learning