e. Did the study involve random assignment to either receive an incentive or not? If yes, what is the advantage? If no, what is the disadvantage? f. An appropriate analysis of the data shows there is evi- dence that people receiving an incentive are more likely to respond to the telephone survey compared to those receiving no incentive. Is it appropriate to conclude that incentives improve response rates? Why or why not? Explain your reasoning.
e. Did the study involve random assignment to either receive an incentive or not? If yes, what is the advantage? If no, what is the disadvantage? f. An appropriate analysis of the data shows there is evi- dence that people receiving an incentive are more likely to respond to the telephone survey compared to those receiving no incentive. Is it appropriate to conclude that incentives improve response rates? Why or why not? Explain your reasoning.

Holt Mcdougal Larson Pre-algebra: Student Edition 2012
1st Edition
ISBN:9780547587776
Author:HOLT MCDOUGAL
Publisher:HOLT MCDOUGAL
Chapter11: Data Analysis And Probability
Section: Chapter Questions
Problem 8CR

Related questions
Question
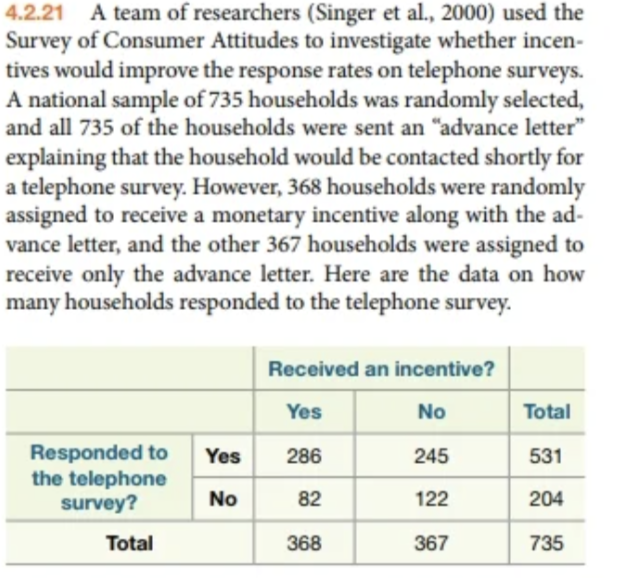
Transcribed Image Text:4.2.21 A team of researchers (Singer et al., 2000) used the
Survey of Consumer Attitudes to investigate whether incen-
tives would improve the response rates on telephone surveys.
A national sample of 735 households was randomly selected,
and all 735 of the households were sent an "advance letter"
explaining that the household would be contacted shortly for
a telephone survey. However, 368 households were randomly
assigned to receive a monetary incentive along with the ad-
vance letter, and the other 367 households were assigned to
receive only the advance letter. Here are the data on how
many households responded to the telephone survey.
Received an incentive?
Yes
No
Total
Responded to
the telephone
survey?
Yes
286
245
531
No
82
122
204
Total
368
367
735
Transcribed Image Text:e. Did the study involve random assignment to either receive
an incentive or not? If yes, what is the advantage? If no,
what is the disadvantage?
f. An appropriate analysis of the data shows there is evi-
dence that people receiving an incentive are more likely
to respond to the telephone survey compared to those
receiving no incentive. Is it appropriate to conclude that
incentives improve response rates? Why or why not?
Explain your reasoning.
Expert Solution
This question has been solved!
Explore an expertly crafted, step-by-step solution for a thorough understanding of key concepts.

This is a popular solution!

Trending now
This is a popular solution!

Step by step
Solved in 2 steps with 2 images

Recommended textbooks for you
Holt Mcdougal Larson Pre-algebra: Student Edition…
Algebra
ISBN:
9780547587776
Author:
HOLT MCDOUGAL
Publisher:
HOLT MCDOUGAL
Holt Mcdougal Larson Pre-algebra: Student Edition…
Algebra
ISBN:
9780547587776
Author:
HOLT MCDOUGAL
Publisher:
HOLT MCDOUGAL