In a recent poll, a random sample of adults in some country (18 years and older) was asked, "When you see an ad emphasizing that a product is "Made in our country." are you more likely to buy it, less likely to buy it, or neither more nor less likely to buy it?" The results of the survey, by age group, are presented in the following contingency table. Complete parts (a) through (c). Purchase likelihood 18-34 35-44 45-54 55 + Total More likely 234 374 388 406 1402 Less likely Neither more nor less likely 289 210 151 110 25 6 22 18 71 760 Total 548 590 561 534 2233 (a) What is the probability that a randomly selected individual is 45 to 54 years of age, given the individual is less likely to buy a product emphasized as "Made in our country"? The probability is approximately (Round to three decimal places as needed.)
In a recent poll, a random sample of adults in some country (18 years and older) was asked, "When you see an ad emphasizing that a product is "Made in our country." are you more likely to buy it, less likely to buy it, or neither more nor less likely to buy it?" The results of the survey, by age group, are presented in the following contingency table. Complete parts (a) through (c). Purchase likelihood 18-34 35-44 45-54 55 + Total More likely 234 374 388 406 1402 Less likely Neither more nor less likely 289 210 151 110 25 6 22 18 71 760 Total 548 590 561 534 2233 (a) What is the probability that a randomly selected individual is 45 to 54 years of age, given the individual is less likely to buy a product emphasized as "Made in our country"? The probability is approximately (Round to three decimal places as needed.)

Chapter9: Sequences, Probability And Counting Theory
Section9.7: Probability
Problem 1SE: What term is used to express the likelihood of an event occurring? Are there restrictions on its...

Related questions

Concept explainers
Contingency Table
A contingency table can be defined as the visual representation of the relationship between two or more categorical variables that can be evaluated and registered. It is a categorical version of the scatterplot, which is used to investigate the linear relationship between two variables. A contingency table is indeed a type of frequency distribution table that displays two variables at the same time.
Binomial Distribution
Binomial is an algebraic expression of the sum or the difference of two terms. Before knowing about binomial distribution, we must know about the binomial theorem.
Topic Video
Question
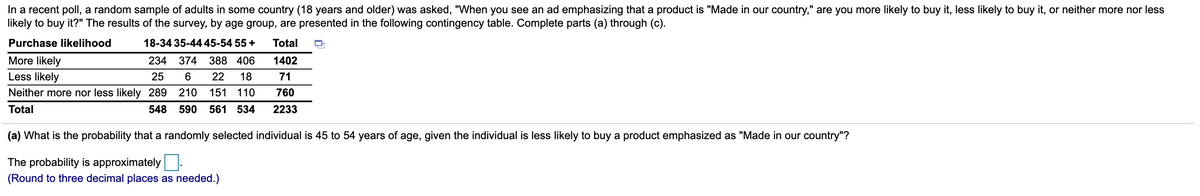
Transcribed Image Text:In a recent poll, a random sample of adults in some country (18 years and older) was asked, "When you see an ad emphasizing that a product is "Made in our country," are you more likely to buy it, less likely to buy it, or neither more nor less
likely to buy it?" The results of the survey, by age group, are presented in the following contingency table. Complete parts (a) through (c).
Purchase likelihood
18-34 35-44 45-54 55 +
Total
More likely
234
374
388 406
1402
Less likely
25
6
22
18
71
Neither more nor less likely 289
210
151
110
760
Total
548
590
561 534
2233
(a) What is the probability that a randomly selected individual is 45 to 54 years of age, given the individual is less likely to buy a product emphasized as "Made in our country"?
The probability is approximately
(Round to three decimal places as needed.)
Expert Solution
This question has been solved!
Explore an expertly crafted, step-by-step solution for a thorough understanding of key concepts.

This is a popular solution!

Trending now
This is a popular solution!

Step by step
Solved in 2 steps with 2 images

Knowledge Booster


Learn more about
Need a deep-dive on the concept behind this application? Look no further. Learn more about this topic, statistics and related others by exploring similar questions and additional content below.Recommended textbooks for you