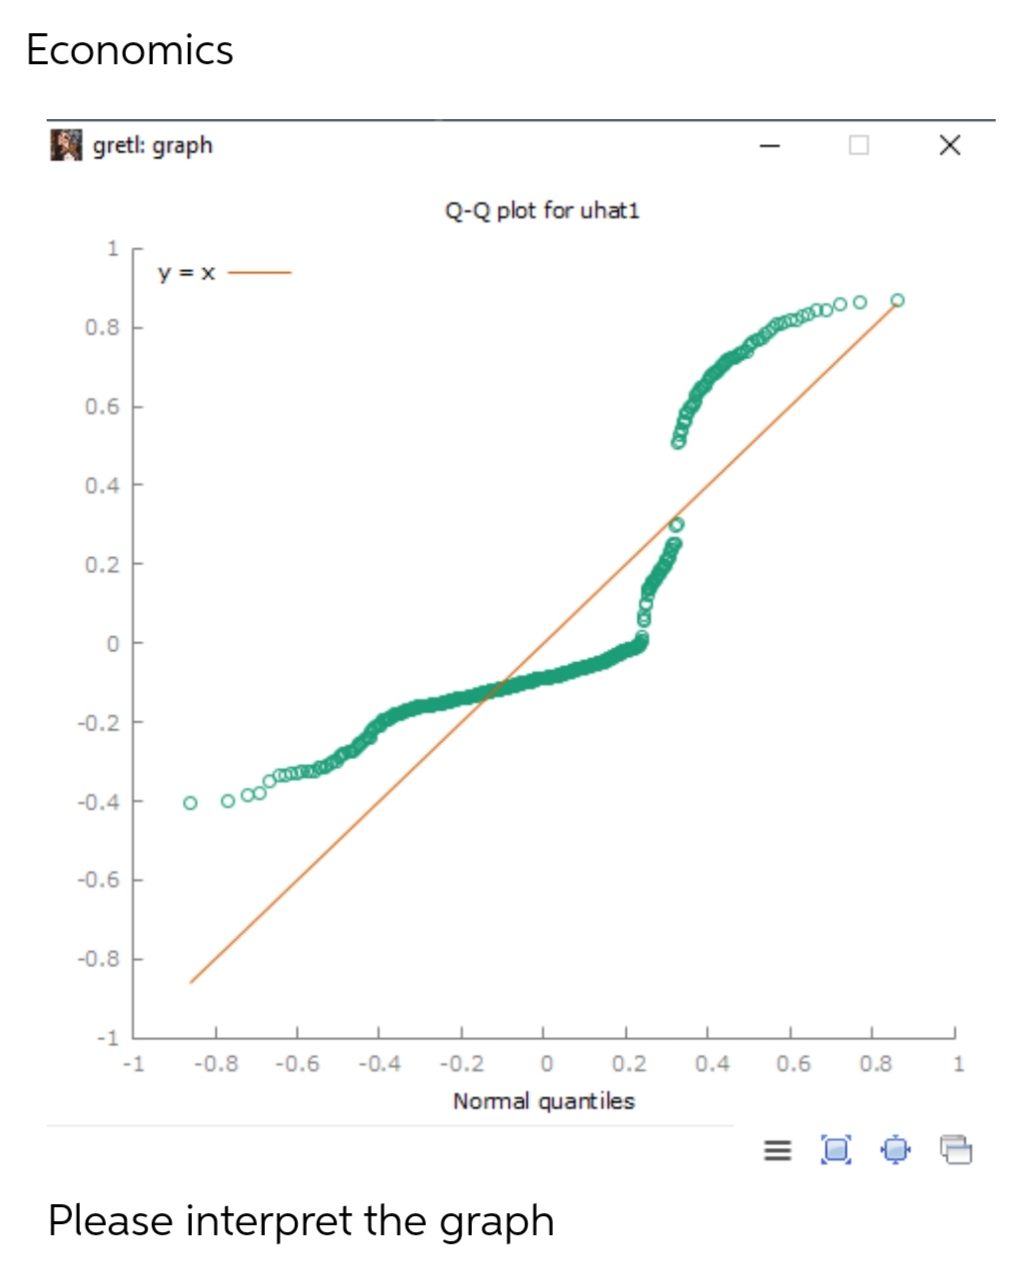
Economics gretl: graph 1 0.8 0.6 0.4 0.2 0 -0.2 -0.4 -0.6 -0.8 T y = x 08 Q-Q plot for uhat1 1 -1 -1 -0.8 -0.6 -0.4 -0.2 0 1 0.2 Normal quantiles Please interpret the graph 1 0.4 1 0.6 1 0.8 1


Q: Interpret the conficient on female in the following regression: sleep-3549-166 totwrk +2.74 age…
A: Given Regression equation sleep=3549-166totwork+2.74 age-85.15 female+u^ ... (1) Sleep is a…
Q: Economic analysis is limited in its ability to forecast precise choices of a given individual…
A: Economic analysis refers to the observation and understanding of the given data to get relevant…
Q: Suppose that average incomes today were $53,468 and are expected to grow at 2.9% each year for the…
A: Given Today's Average income P =$53,468 Expected growth rate GE = 2.9% Growth rate if the policy is…
Q: 1975, still the early dawn of the computer era, Kodak invented the first digital camera. At that…
A: Entrepreneurial orientation: It is a key idea when leaders are making methodologies with…
Q: 57. Behavioral economics suggests that incentivizing people to save more of their income: A) entails…
A: Answer :- Option (E) is correct :- A & B only
Q: Next Friday, you plan to sell cakes at a bake sale to raise money for your school. You plan to…
A: Cost: It refers to the price of goods and services. The cost of the goods and services changes with…
Q: A baseball player has signed a new 5-year contract that will pay him $3 Million in year 1,…
A: Given Length of contract = 5 years so n =5 Yearly payment A = $3 million which increases by $0.5…
Q: Moving to the next question prevents changes to this answer. Question 18 Say's Law applies only in…
A: Say's Law of Markets is theory from classical economics contending that the capacity to purchase…
Q: (a) Rank the three economic variables from most important to least important. Provide one relevant…
A: The Gross Domestic Product (GDP), the inflation rate (inflation), and the interest rate (interest…
Q: Explain the Budget Cycle enumerating the four (4) phases and the steps for each process.
A: Introduction A budget is a value that sets the monetary value of all future activities and course of…
Q: O a. $35. Ob. $46. Oc$40. O d. $29. Quantity Private Value Private Cost External Cost (Units)…
A: So first we calculate Social cost = Private cost + external cost Surplus value = private value -…
Q: James purchases a $20,000 6-month certificate of deposit. Is this counted in M1 only, M2 only, M1…
A: Answer: Certificate of deposits: it refers to the time deposit. It is a financial instrument that is…
Q: Use the following table to calculate the price elasticity of supply for computers. Quantity Supplied…
A: Price elasticity of supply is measurement of the responsiveness to the supply of a good or service…
Q: Which component(s) of U.S. real GDP decreased in size relative to total U.S. real GDP from 1900 to…
A: Usually the sectors of economy are divided into following parts : agriculture, industrial and…
Q: Discuss the role of government in financial intermediation. Do you think government must be a player…
A: The primary goal of financial intermediation is to facilitate funding between savers and borrowers.…
Q: What rate of interest compounded annually must be received if an investment of P5,400 made now will…
A: According to the question, it is given that : Principal (P) = P 5400 Amount (A) = P 7200 Time (t)…
Q: what is the differences between fiscal policy and monetary policy
A: Monetary policy and fiscal policy are two distinct tools that have an impact on the economic…
Q: The city-cleaning workers guild faces an own wage elasticity of demand for labor equal to -0.3. The…
A: The wage elasticity of demand for labour is the responsiveness of demand of labour with the change…
Q: The long-run supply curve for a particular type of kitchen knife is a hori- zontal line at a price…
A: The long-run supply is the inventory of merchandise accessible when all sources of info are…
Q: During the 2020 campaign, Joe Biden proposed raising income taxes on those earning more than…
A: The equilibrium is set up where the aggregate demand and aggregate supply are equal. Change in the…
Q: National Company borrows from a bank a certain loan at a stated discount rate of 12% per annum. The…
A: An effective annual interest rate is the genuine profit from an investment account or any…
Q: Price Level Ps P₂ P₁ Y₁ LRAS Y₂ Y₁ AD₂ SRAS AD₁ Quantity of Output At which level of output is this…
A: Equilibrium in the AD/AS model is determined at the intersection of AD and AS.
Q: BYOB is a monopolist in beer production and distribution in the imaginary economy of Hopsville.…
A: An person, organization, or corporation that dominates and controls the market for a particular…
Q: The risk-free rate is 3.7%, and expected inflation is 2.2%. If inflation expectations change such…
A: new risk free rate is the rate where risk is zero on investment , means that this is the rate at…
Q: A household has $5 in wealth and faces a MB of consumption of $1.66, 1.44, 1.31, 1.22 and 1.18 for…
A: The household saving rate is characterized as gross household saving separated by gross…
Q: (Figure: Determining Profit) At price F, which of the following is NOT true for this firm in perfect…
A: Perfect competition:- According to theoretical framework, perfectly competitive exists when all…
Q: 2. A refrigerator manufacturer is planning capacity expansions. They have determined that their…
A: Capacity Cost are in the form : F(y) = kya For above example , a = 0.62 & k = 0.0107 Demand is…
Q: Question 4 (A) Explain the factors that affect the price elasticity of demand for a product.
A: Price elasticity is the measure which states the relationship between change in price and change in…
Q: As the price level falls, the purchasing power of households' real wealth will rise remain the same…
A: Hi! thanks for the question but as per the guidelines, we answer up to three parts at a time. Kindly…
Q: If resource prices rise and the per-unit cost of producing a product increases as the firms in an…
A: Long run supply curve refers to the portion of marginal cost curve which is above average total…
Q: Explain if the statement is true, false or uncertain: If a two-player, two-strategy game has two…
A: When playing a non-cooperative game with no incentive for either participant to modify their…
Q: QUESTION 19 The difference between the Ricardian model of trade and the immobile factor model is…
A: Even though the LDC business pays lower wages, it is conceivable for an industry in a developed…
Q: 5. Choose the item that represents an expense. A. Wages from a part-time job B. Loan payment Dir…
A: Hi! Thank you for the question, As per the honor code, we are allowed to answer three sub-parts at a…
Q: Use interest tables. Suppose that $1,000 is invested for 4 years at an interest rate of 12%,…
A: Following is the given information: Investment amount = $1000 Investment made for time period = 4…
Q: Sample: 2000Q1 2021Q4 Lags: 2 Null Hypothesis: LX1 does not Granger Cause LY LY does not Granger…
A: When P value is less than 0.05 ( 5 % significance level) we reject null hypothesis. Now, 0.0413…
Q: The snowboard industry has the following labour supply is ES = 150 + 10w and labour demand is ED =…
A: Given that the labour supply, ES = 150 + 10w and the labour demand, ED = 350 -10w where the number…
Q: When workers do not notice inflation has taken place they do not realize that their real wage has…
A: Answer to the question is as follows:
Q: Identify and discuss briefly three (3) Cost Drivers that may impact the costs incurred in the…
A: Let's look at the top three cost factors affecting the Caribbean airline industry's costs.
Q: Critically discuss the danger posed by the fiat monetary system and the fractional reserve banking…
A: Fiat cash is official money that isn't upheld by a ware like gold. Fiat cash gives national banks…
Q: Consider the competitive market for titanium. Assume that, regardless of how many firms are in the…
A: Answer: The supply curve of a perfectly competitive firm: the short-run supply curve of a perfectly…
Q: Your Facebook feed shows a news article which says the Consumer Confidence Index has decreased.…
A: My Facebook feed shows a news article which says the Consumer Confidence Index has decreased. It's…
Q: Table 20-3 The Distribution of Income in Edgerton Group Bottom Quintile Second Quintile Middle…
A: The poverty threshold, poverty limit, poverty line or breadline is the base degree of pay considered…
Q: Which of the following statements applies to a monopolist but not to a perfectly competitive firm at…
A: Profit maximization occurs at the point where the marginal revenue and marginal cost are equal.
Q: hich statement is NOT true? a. Government expenditure has direct control of a country's economic…
A: Government expenditure is aimed at stabilizing economy and reducing income inequalities. Government…
Q: Income from sales of by-products at a small meat packing plant have been increasing by 10% each…
A: Given pieces of information: The for the first year = $22000 Increase in income from sales, g = 10%…
Q: An economy is currently at it's steady state. Their depreciation rate is 7% 4,274. What will be…
A:
Q: (1) The following table summarizes information, which are associated with three new 3D Printers…
A: A cash flow analysis decides an organization's functioning capital — how much cash is accessible to…
Q: The travel time (t) on the segment of a highway connecting city A with city B has been observed to…
A: Given, t=15+0.02v v=3500-120t
Q: Country A produces GDP according to the following equation: GDP 5√K. The country has a depreciation…
A:
Q: hat is the future worth of P 6000.00 deposited at the end of every month for four years if the…
A:
2

Step by step
Solved in 2 steps


- Savings-Mart (a chain of discount department stores) sells patio and lawn furniture. Sales are seasonal, with higher sales during the spring and summer quarters and lower sales during the fall and winter quarters. The company developed the following quarterly sales forecasting model: Y t=8.25+0.125t2.75D1t+3.50D3t where Y t=predictedsales(million)inquartert 8.25=quarterlysales(million)whent=0 t=timeperiod(quarter)wherethefourthquarterof2002=0,firstquarterof2003=1,secondquarterof2003=2,... D1t={1forfirst-quarterobservations0otherwiseD2t={1forsecond-quarterobservations0otherwiseD3t={1forthird-quarterobservations0otherwise Forecast Savings-Marts sales of patio and lawn furniture for each quarter of 2010.Plot the logarithm of arrivals for each transportation mode against time, all on the same graph. Which now appears to be growing the fastest?A researcher has a sample of 6 annual observations {94, 104, 102, 99, 111 and 107} for the CPI in country Z for the period 2015 to 2020, and wants to forecast CPI for the years 2021, 2022 and 2023. The researcher uses 3 different forecasting models: A, B and C. Model A is an AR(1) model with no drift and with an estimated autoregressive coefficient = 0.7. Model B is a MA(1) model with no constant and with an estimated MA coefficient = -0.4 (note the minus !). Model C is a random walk model with no drift. The error terms over the 2015-2020 period were estimated to have the values: {3, -1, 2, 4, -3, 1}. a. Compute the 2021, 2022 and 2023 forecasted values for the consumer price index based on the three models. Show the formulas and the details of your calculations, and explain all the related symbols. b. Suppose that the actual values of the CPI over the 2021, 2022 and 2023 were {108, 114, 105}. Calculate the Root mean square error of the three model forecasts over the 2021-2023…
- Suppose that you work for a U.S. senator who is contemplating writing a bill that would put a national sales tax in place. Because the tax would be levied on the sales revenue of retail stores, the senator has asked you to prepare a forecast of retail store sales for year 8, based on data from year 1 through year 7. The data are: (c1p2) Year Retail Store Sales 1 $1,225 2 1,285 3 1,359 4 1,392 5 1,443 6 1,474 7 1,467 54 Chapter One a. Use the first naive forecasting model presented in this chapter to prepare a forecast of retail store sales for each year from 2 through 8. b. Prepare a time-series graph of the actual and forecast values of retail store sales for the entire period. (You will not have a forecast for year 1 or an actual value for year 8.) c. Calculate the root-mean-squared error for your forecast series using the values for year 2 through year 7. 3. Use the second naive forecasting model presented in this chapter to answer parts (a) through (c) of Exercise 2. Use P 0.2 in…Consider the following numerical example of the IS-LM model: C= 100 + 0.3Yd ; I = 150 + 0.2Y – 1000 i ; G = 200 ; T = 100. Derive the IS relation. I've got the answer written down as =400+0.5Y-500i can someone please provide solutions as to how it is this.With respect to a given product, describe the connection that exists between equalibrium/disequalibrium and prediction. cite an unique example
- The use of quarterly data to develop the forecasting model Yt = a +bYt-1 is an example of which forecasting technique?The type of economic indicator that can best be used for business forecasting is the:Based on annual data from 2000-2010, the Gadget Company estimates that sales are growing according to a linear trend: Q = 50,000 + 200t where t is time and t = 0 in 2000. a. Forecast sales for 2013. b. Do you see any problems with this forecasting method?