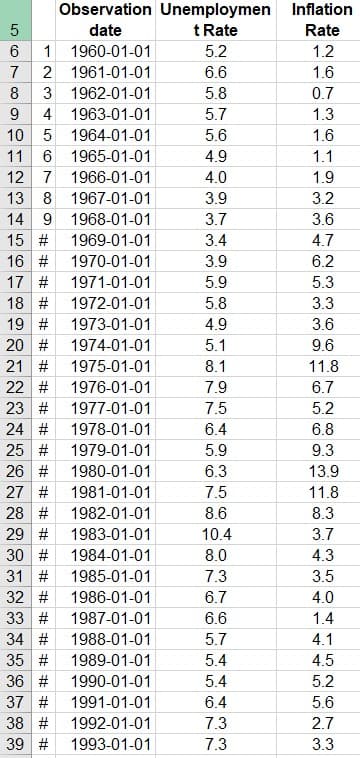
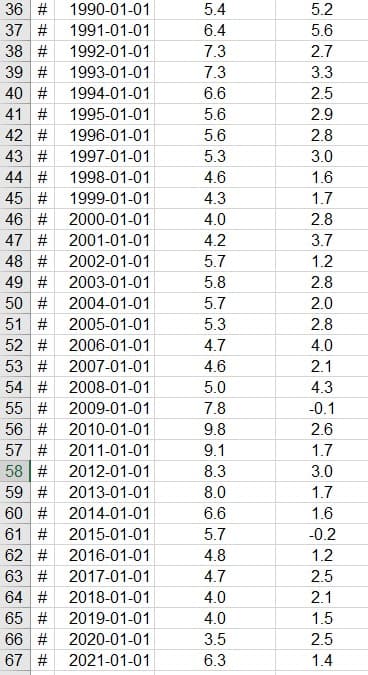
Economist A.W. Phillips was one of the first economists to present compelling evidence of the correlation between unemployment and wage inflation. Since wages and salaries are a major input cost for companies, rising wages should lead to higher prices for products and services in an economy, ultimately pushing the overall inflation rate higher. As a result, Phillips graphed the relationship between general price inflation and unemployment, rather than wage inflation. Data on unemployment (independent) and inflation (dependent) from the Federal Reserve is on the Excel workbook. a) Find the equation for the regression line for this data. b) Find the correlation coefficient and R2 . c) Using the data, is the correlation statistically significant at the 1% level? please do it in excel


Economist A.W. Phillips was one of the first economists to present compelling evidence
of the
are a major input cost for companies, rising wages should lead to higher prices for
products and services in an economy, ultimately pushing the overall inflation rate higher.
As a result, Phillips graphed the relationship between general price inflation and
unemployment, rather than wage inflation. Data on unemployment (independent) and
inflation (dependent) from the Federal Reserve is on the Excel workbook.
a) Find the equation for the regression line for this data.
b) Find the
.
c) Using the data, is the correlation statistically significant at the 1% level?
please do it in excel


Trending now
This is a popular solution!

Step by step
Solved in 4 steps with 1 images


