The median incomes of males in a random sample of 30 states of the United States, including the District of Columbia and Puerto Rico, are given in the table below ('Median income of,' 2013). Create a frequency distribution and a relative frequency distribution using 7 classes. a) Since data were collected for variable(s), the correct graph to make is a b) Using the formula class width = (maxX - minX)/(number of classes) and rounding up to the next whole number, the class width is Complete the frequency/relative frequency table using 7 classes. Round relative frequencies to 3 decimal places. c) Which of the following is the correct histogram for the given data?


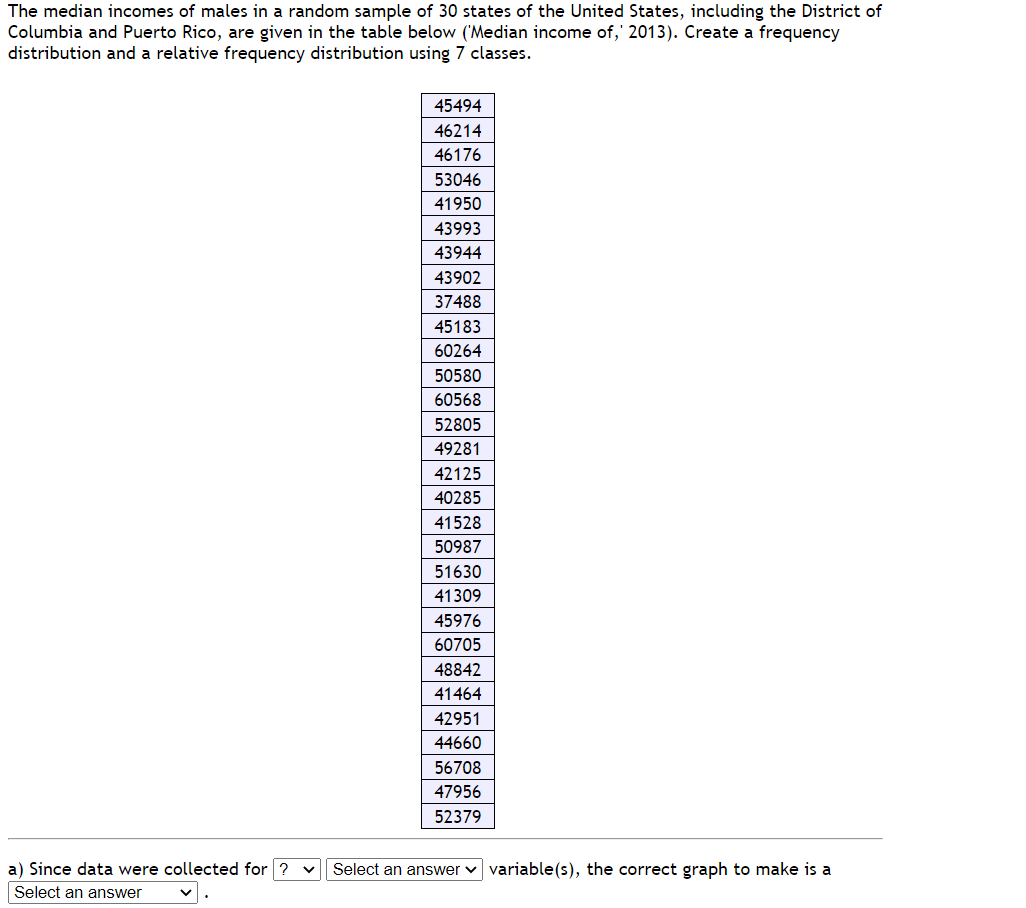
The median incomes of males in a random sample of 30 states of the United States, including the District of Columbia and Puerto Rico, are given in the table below ('Median income of,' 2013). Create a frequency distribution and a relative frequency distribution using 7 classes.
a) Since data were collected for variable(s), the correct graph to make is a
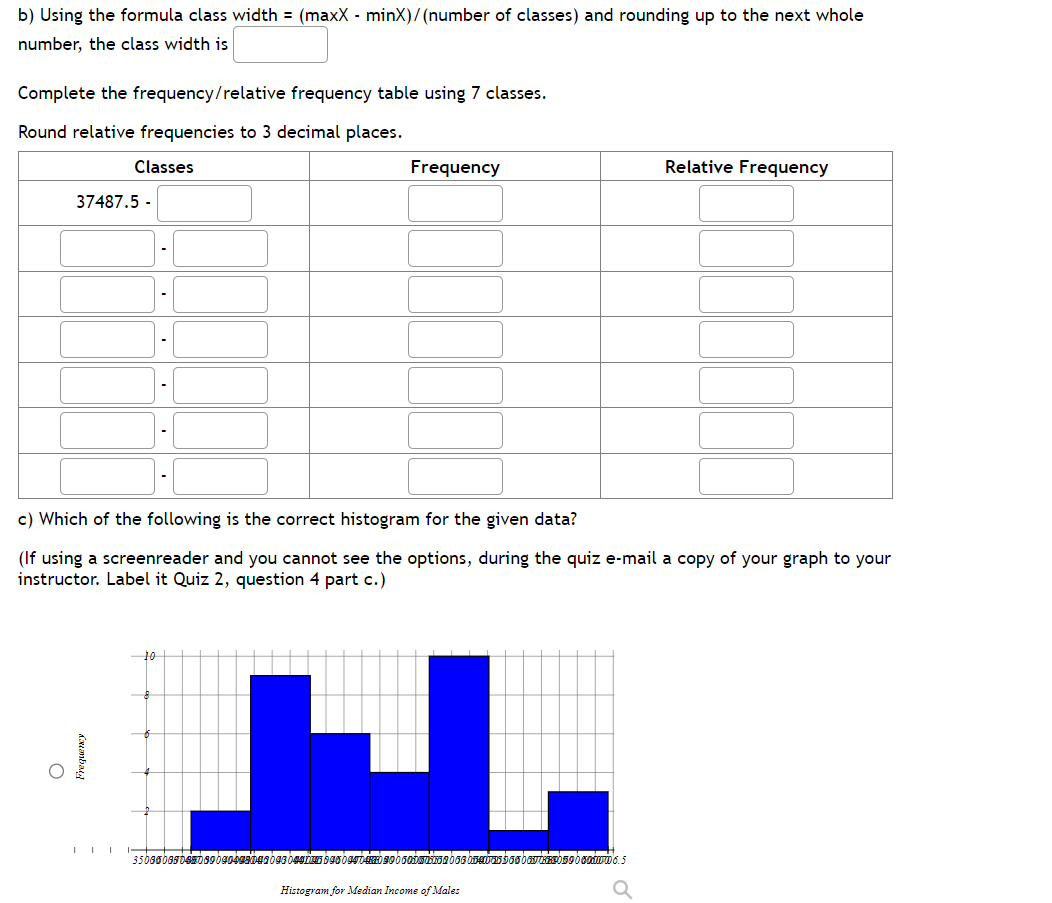
b) Using the formula class width = (maxX - minX)/(number of classes) and rounding up to the next whole number, the class width is
Complete the frequency/relative frequency table using 7 classes.
Round relative frequencies to 3 decimal places.
c) Which of the following is the correct histogram for the given data?


Trending now
This is a popular solution!

Step by step
Solved in 5 steps with 2 images


