Espahol A nationwide job recruiting firm wants to compare the annual incomes for childcare workers in Utah and Oregon. Due to recent trends in the childcare industry, the firm suspects that the mean annual income of childcare workers in Utah is less than the mean annual income of childcare workers in Oregon. To see if this is true, the firm selected a random sample of 20 childcare workers from Utah and an independent random sample of 20 childcare workers from Oregon and asked them to report their mean annual income. The data obtained were as follows. Annual income in dollars 40473, 39248, 37924, 24607, 38261, 38133, 35602, 39966, 39104, 38624, 41390, 35716, 39302, 35384, 45697, 40071, 39016, 46759, 39448, 33184 36902, 42116, 40609, 44142, 30405, 37857, 35284, 38718, 41701, 33850, 35941, 35507, 42560, 45685, 41987, 31004, 38220, 38480, 46801, 41005 Utah Oregon Send data to calculator Send data to Excel The population standard deviation for the annual incomes of childcare workers in Utah and in Oregon are estimated as 6400 and 6500, respectively. It is also known that both populations are approximately normally distributed. At the 0.05 level of significance, is there sufficient evidence to support the claim that the mean annual income, H, of childcare workers in Utah is less than the mean annual income, Hy, of childcare workers in Oregon? Perform a one-tailed test. Then complete the parts below. Carry your intermediate computations to at least three decimal places. (If necessary, consult a list of formulas.) (a) State the null hypothesis H, and the alternative hypothesis Hq. P H, :0 H, :0 (b) Determine the type of test statistic to use. (Choose one) (c) Find the value of the test statistic. (Round to three or more decimal places.) OsO ? (d) Find the p-value. (Round to three or more decimal places.) (e) Can we support the claim that the mean annual income of childcare workers in Utah is less than the mean annual income of childcare workers in Oregon? O Yes ONo
Espahol A nationwide job recruiting firm wants to compare the annual incomes for childcare workers in Utah and Oregon. Due to recent trends in the childcare industry, the firm suspects that the mean annual income of childcare workers in Utah is less than the mean annual income of childcare workers in Oregon. To see if this is true, the firm selected a random sample of 20 childcare workers from Utah and an independent random sample of 20 childcare workers from Oregon and asked them to report their mean annual income. The data obtained were as follows. Annual income in dollars 40473, 39248, 37924, 24607, 38261, 38133, 35602, 39966, 39104, 38624, 41390, 35716, 39302, 35384, 45697, 40071, 39016, 46759, 39448, 33184 36902, 42116, 40609, 44142, 30405, 37857, 35284, 38718, 41701, 33850, 35941, 35507, 42560, 45685, 41987, 31004, 38220, 38480, 46801, 41005 Utah Oregon Send data to calculator Send data to Excel The population standard deviation for the annual incomes of childcare workers in Utah and in Oregon are estimated as 6400 and 6500, respectively. It is also known that both populations are approximately normally distributed. At the 0.05 level of significance, is there sufficient evidence to support the claim that the mean annual income, H, of childcare workers in Utah is less than the mean annual income, Hy, of childcare workers in Oregon? Perform a one-tailed test. Then complete the parts below. Carry your intermediate computations to at least three decimal places. (If necessary, consult a list of formulas.) (a) State the null hypothesis H, and the alternative hypothesis Hq. P H, :0 H, :0 (b) Determine the type of test statistic to use. (Choose one) (c) Find the value of the test statistic. (Round to three or more decimal places.) OsO ? (d) Find the p-value. (Round to three or more decimal places.) (e) Can we support the claim that the mean annual income of childcare workers in Utah is less than the mean annual income of childcare workers in Oregon? O Yes ONo

Trigonometry (MindTap Course List)
8th Edition
ISBN:9781305652224
Author:Charles P. McKeague, Mark D. Turner
Publisher:Charles P. McKeague, Mark D. Turner
Chapter8: Complex Numbers And Polarcoordinates
Section: Chapter Questions
Problem 2RP: A Bitter Dispute With the publication of Ars Magna, a dispute intensified between Jerome Cardan and...

Related questions
Question
Transcribed Image Text:O BUSAD265 Ch11 Hypothesis Te X
A ALEKS - Kierra Alford - Learn
b Answered: (a) State the null hy x
E Z-test for two Means, with Kno x
Order 356230645
+
A www-awu.aleks.com/alekscgi/x/lsl.exe/1o_u-IgNsIkr7j8P3jH-lv-Y-mBdRDk1FzbOsPOiMQwqFYZIN5rXLxPuxnZq4jpYsPJ_OS5M1twf2Ei_4kozoqYNMJlb13a8UsVom..
Update
O CONFIDENCE INTERVALS AND HYPOTHESIS TESTING
Kierra v
Hypothesis test for the difference of population means: Z test
(Español
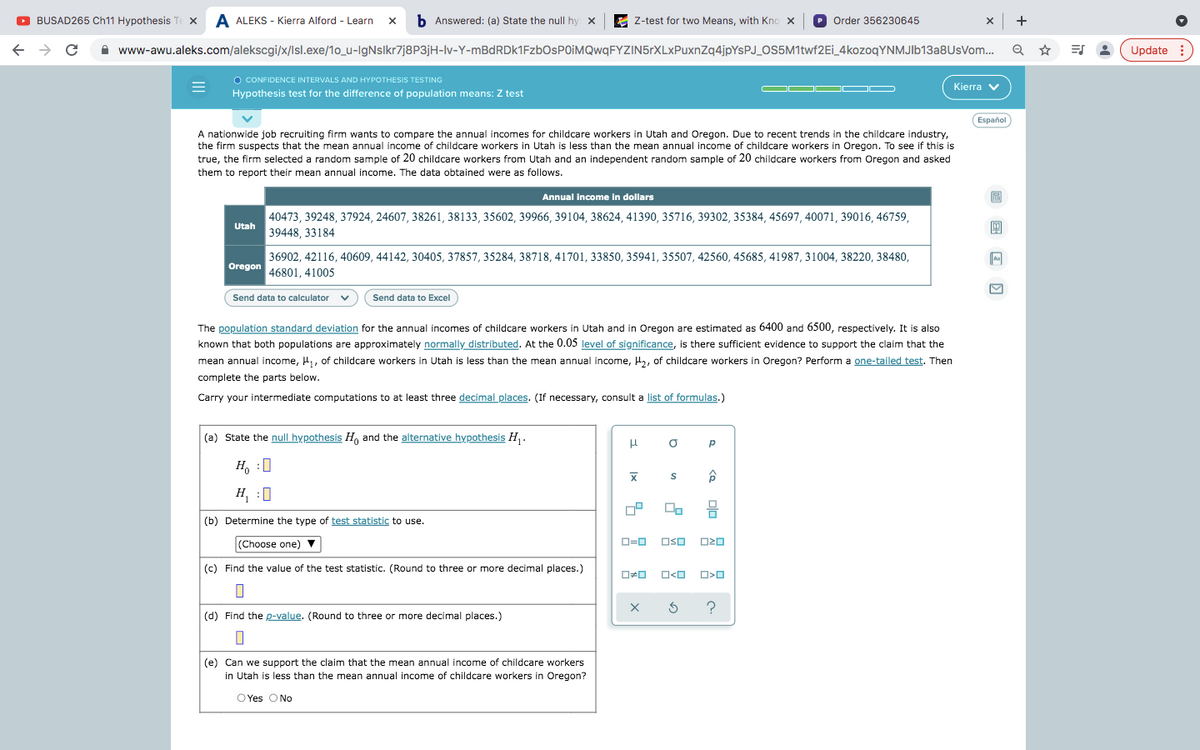
A nationwide job recruiting firm wants to compare the annual incomes for childcare workers in Utah and Oregon. Due to recent trends in the childcare industry,
the firm suspects that the mean annual income of childcare workers in Utah is less than the mean annual income of childcare workers in Oregon. To see if this is
true, the firm selected a random sample of 20 childcare workers from Utah and an independent random sample of 20 childcare workers from Oregon and asked
them to report their mean annual income. The data obtained were as follows.
Annual income in dollars
40473, 39248, 37924, 24607, 38261, 38133, 35602, 39966, 39104, 38624, 41390, 35716, 39302, 35384, 45697, 40071, 39016, 46759,
39448, 33184
Utah
36902, 42116, 40609, 44142, 30405, 37857, 35284, 38718, 41701, 33850, 35941, 35507, 42560, 45685, 41987, 31004, 38220, 38480,
Oregon 46801, 41005
Send data to calculator
Send data to Excel
annual incomes of childcare workers in Utah and in Oregon are estimated as 6400 and 6500, respectively. It is also
known that both populations are approximately normally distributed. At the 0.05 level of significance, is there sufficient evidence to support the claim that the
The population standard deviation for
mean annual income, H, of childcare workers in Utah is less than the mean annual income, H2, of childcare workers in Oregon? Perform a one-tailed test. Then
complete the parts below.
Carry your intermediate computations to at least three decimal places. (If necessary, consult a list of formulas.)
(a) State the null hypothesis H, and the alternative hypothesis H,.
H, :0
H, :0
(b) Determine the type of test statistic to use.
(Choose one)
D=0
OSO
(c) Find the value of the test statistic. (Round to three or more decimal places.)
O<O
(d) Find the p-value. (Round to three or more decimal places.)
(e) Can we support the claim that the mean annual income of childcare workers
in Utah is less than the mean annual income of childcare workers in Oregon?
O Yes O No
<Q 미 A ~
Expert Solution
This question has been solved!
Explore an expertly crafted, step-by-step solution for a thorough understanding of key concepts.

This is a popular solution!

Trending now
This is a popular solution!

Step by step
Solved in 6 steps with 1 images

Recommended textbooks for you
Trigonometry (MindTap Course List)
Trigonometry
ISBN:
9781305652224
Author:
Charles P. McKeague, Mark D. Turner
Publisher:
Cengage Learning

Algebra & Trigonometry with Analytic Geometry
Algebra
ISBN:
9781133382119
Author:
Swokowski
Publisher:
Cengage

Linear Algebra: A Modern Introduction
Algebra
ISBN:
9781285463247
Author:
David Poole
Publisher:
Cengage Learning
Trigonometry (MindTap Course List)
Trigonometry
ISBN:
9781305652224
Author:
Charles P. McKeague, Mark D. Turner
Publisher:
Cengage Learning
Algebra & Trigonometry with Analytic Geometry
Algebra
ISBN:
9781133382119
Author:
Swokowski
Publisher:
Cengage
Linear Algebra: A Modern Introduction
Algebra
ISBN:
9781285463247
Author:
David Poole
Publisher:
Cengage Learning