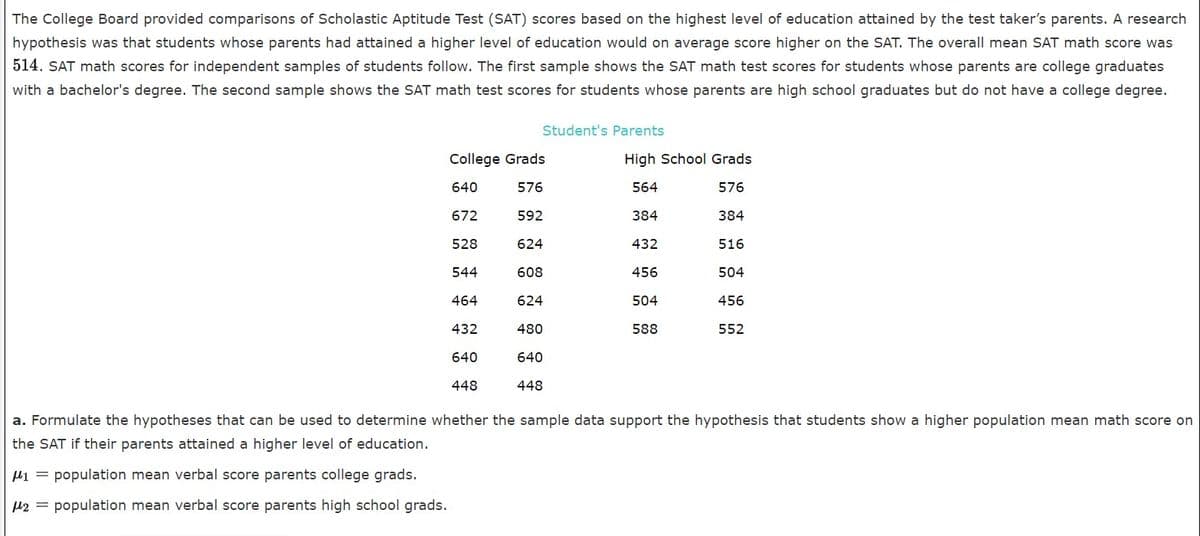
The College Board provided comparisons of Scholastic Aptitude Test (SAT) scores based on the highest level of education attained by the test taker's parents. A research hypothesis was that students whose parents had attained a higher level of education would on average score higher on the SAT. The overall mean SAT math score was 514. SAT math scores for independent samples of students follow. The first sample shows the SAT math test scores for students whose parents are college graduates with a bachelor's degree. The second sample shows the SAT math test scores for students whose parents are high school graduates but do not have a college degree.
The College Board provided comparisons of Scholastic Aptitude Test (SAT) scores based on the highest level of education attained by the test taker's parents. A research hypothesis was that students whose parents had attained a higher level of education would on average score higher on the SAT. The overall mean SAT math score was 514. SAT math scores for independent samples of students follow. The first sample shows the SAT math test scores for students whose parents are college graduates with a bachelor's degree. The second sample shows the SAT math test scores for students whose parents are high school graduates but do not have a college degree.

Glencoe Algebra 1, Student Edition, 9780079039897, 0079039898, 2018
18th Edition
ISBN:9780079039897
Author:Carter
Publisher:Carter
Chapter10: Statistics
Section10.3: Measures Of Spread
Problem 1GP

Related questions
Question
The College Board provided comparisons of Scholastic Aptitude Test (SAT) scores based on the highest level of education attained by the test taker’s parents. A research hypothesis was that students whose parents had attained a higher level of education would on average score higher on the SAT. The overall mean SAT math score was . SAT math scores for independent samples of students follow. The first sample shows the SAT math test scores for students whose parents are college graduates with a bachelor's degree. The second sample shows the SAT math test scores for students whose parents are high school graduates but do not have a college degree.
Transcribed Image Text:The College Board provided comparisons of Scholastic Aptitude Test (SAT) scores based on the highest level of education attained by the test taker's parents. A research
hypothesis was that students whose parents had attained a higher level of education would on average score higher on the SAT. The overall mean SAT math score was
514. SAT math scores for independent samples of students follow. The first sample shows the SAT math test scores for students whose parents are college graduates
with a bachelor's degree. The second sample shows the SAT math test scores for students whose parents are high school graduates but do not have a college degree.
Student's Parents
College Grads
High School Grads
640
576
564
576
672
592
384
384
528
624
432
516
544
608
456
504
464
624
504
456
432
480
588
552
640
640
448
448
a. Formulate the hypotheses that can be used to determine whether the sample data support the hypothesis that students show a higher population mean math score on
the SAT if their parents attained a higher level of education.
µ1 = population mean verbal score parents college grads.
µ2 = population mean verbal score parents high school grads.
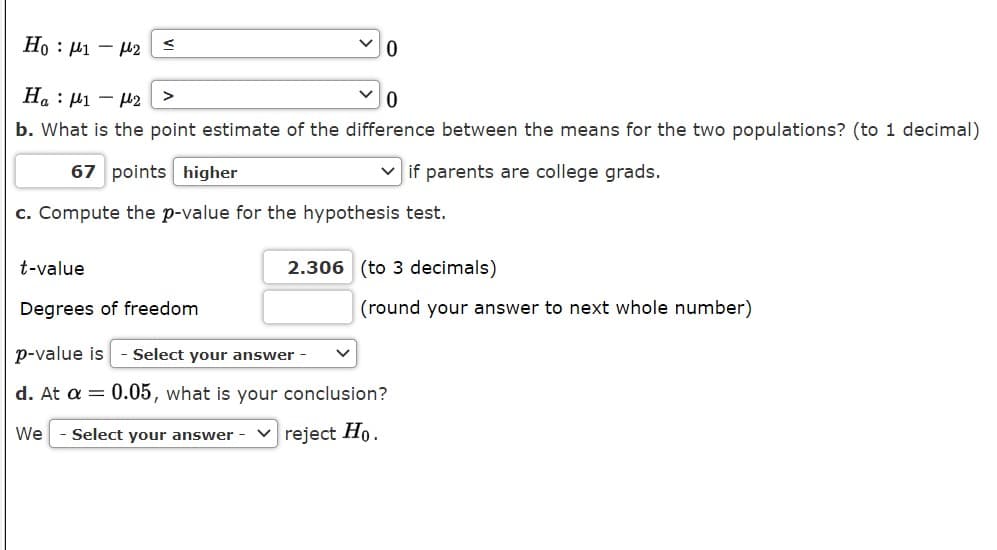
Transcribed Image Text:Ho : µ1 – 42
Ha : µ1 – µ2
b. What is the point estimate of the difference between the means for the two populations? (to 1 decimal)
67 points higher
if parents are college grads.
c. Compute the p-value for the hypothesis test.
t-value
2.306 (to 3 decimals)
Degrees of freedom
(round your answer to next whole number)
p-value is
Select your answer -
d. At a = 0.05, what is your conclusion?
We
Select your answer -
reject Ho.
Expert Solution
This question has been solved!
Explore an expertly crafted, step-by-step solution for a thorough understanding of key concepts.

This is a popular solution!

Trending now
This is a popular solution!

Step by step
Solved in 3 steps with 6 images

Recommended textbooks for you
Glencoe Algebra 1, Student Edition, 9780079039897…
Algebra
ISBN:
9780079039897
Author:
Carter
Publisher:
McGraw Hill

College Algebra (MindTap Course List)
Algebra
ISBN:
9781305652231
Author:
R. David Gustafson, Jeff Hughes
Publisher:
Cengage Learning

Glencoe Algebra 1, Student Edition, 9780079039897…
Algebra
ISBN:
9780079039897
Author:
Carter
Publisher:
McGraw Hill
College Algebra (MindTap Course List)
Algebra
ISBN:
9781305652231
Author:
R. David Gustafson, Jeff Hughes
Publisher:
Cengage Learning