Estimate the variance of the number of FHH members. Upload a snapshot of your solution. Estimate the variance of the sample means of the number of FHH members for samples of size 15 taken from the population of FHHs in Brgy
Q: lculate the number of shops corresponding to class-interval 30-40 of the following distribution: Pro...
A:
Q: The mean price of a pound of ground beef in 75 cities in the Midwest is $2.11 and the standard devia...
A:
Q: ones
A: The binomial distribution comes with two parameters n and p. The probability distribution becomes a ...
Q: Suppose that the random variable X has the discrete uniform distribution S 114, x = 4, 5, 6, 7. f(x)...
A: P(X>5.7)= ?
Q: Refers to the population which consists of the objects or entities under consideration in the survey...
A: The correct option is (B) Statistical Population. Because, The sampled population is the population ...
Q: Two stable populations employ the same fertility schedule, but different mortality schedule. In both...
A:
Q: Anita's, a fast-food chain specializing in hot dogs and garlic fries, keeps track of the proportion ...
A:
Q: The appropriate test procedure to use to verify the psychologist's claim is O Two-tailed One Sample ...
A:
Q: One hundred people are included in a study in which they are compared to a known population that has...
A: Given data n=100μ=73σ=20
Q: A credit card company claims that the mean credit card debt for individuals is greater than $5,200. ...
A: Given: x=5414σ=675n=34
Q: Find the critical value(s) and rejection region(s) for the indicated t-test, level of significance a...
A:
Q: Juicy-Juice Ltd. wants to predict their sales for the fiscal year 2021, and the financial team was p...
A: iv. Exponential Smoothing: Given that α=0.4. Initial forecast for January is $130,000. St=0.4yt-1+1...
Q: A high school teacher has designed a new course intended to help students prepare for the mathematic...
A:
Q: The "Freshman 15" refers to the belief that college students gain 15 lb (or 6.8 kg) during their fre...
A:
Q: Check our blood pressure: In a recent study, the Centers for Disease Control and prevention reported...
A: Given data,Mean μ=80.3sd σ=9.7P(X<68)=?
Q: 9 9.13. Admissions during 1971 to 'Vidya Mandir,' and "Children's Home' increased by 20% and 40% res...
A:
Q: A study was conducted by Grade 11 STEM students to investigate the health hazards of working long ho...
A: The given claim that if the mean amount of time (in hours) before the specified symptom develops is ...
Q: Find the area of the shaded region. The graph to the right depicts IQ scores of adults, and those sc...
A:
Q: Illustration 9.7. The mean weight of 150 students in certain class is 60 kilograms. The mean weight ...
A:
Q: Suppose that the Department of Statistics in CLSU was given slots to send 3 students to an Internati...
A:
Q: It takes an average of 8 minutes for blood to begin clotting after an injury. An EMT wants to see if...
A: Given The data is as follows: Pop. mean, μ=8Sample size, n=62Sample mean, x¯=7.8Sample sd, s=2.3α=0....
Q: The ages of the 5 officers for a school club are 18, 18, 17, 16, and 15. The minimum of the ages of ...
A: The ages for 5 officers of a school club are 18,18,17,16,15. Ymin be the population minimum. Here, t...
Q: For numbers 2 to 4: Sunscreens are products that protect the skin from skin cancer by preventing the...
A:
Q: Tablé 9.5 gives the distribution of 500 firms in an industry according to the sales volume. Calculat...
A:
Q: In rolling a pair of six sided dice, where each die might land with between one and six spots on the...
A: The total number of outcomes is 36.
Q: In a 2006 study, Gortmake and colleagues surveyed 80 lesbian and gay students at a large Midwestern ...
A: Chi square estimate the relationship between the two categorical variable. Each categorical variable...
Q: Last year at Berries Bots, the call-in customer service phone line received a total of 56% positive ...
A: Given H0: π=0.56Ha: π<0.56
Q: 10. If the p-value of the appropriate test procedure is equal to 0.0082, which of the following is(a...
A:
Q: Answer the following problems with random samples taken from the normal population (The choices are...
A: Note: According to bartleby experts question answers guidelines an expert can solve only first quest...
Q: Suppose that 29% of people have a dog, 19% of people have a cat, and 14% of people own both. What is...
A:
Q: and then transfer to a second bus. Let Y denote the waiting time (in minutes) for the school bus. As...
A:
Q: Answer 4-6 only show complete solutions
A: Given The data is as follows: Pop. mean, μ=200Sample size, n=100Sample mean, x¯=190Pop sd, σ=30α=0.0...
Q: list of names of countries would be an example of a) Interval data b) Ratio data c) Nominal data...
A: We know that, list of name comes under nominal scale.
Q: Exit polling is a popular technique used to determine the outcome of an election prior to results be...
A: Introduction: Denote p̂ as the sample proportion of voters who voted for the referendum, in a random...
Q: . What is the probability that 187 or more of the sample will approve of President Biden’s andling o...
A:
Q: Which of the following is(are) TRUE? * I. Based on the sample of 654 young adults, a point estimate ...
A: From the output, 95% confidence interval is, (13.572, 15.872) Interpretation: There is a 95% chance ...
Q: Illustration 8.7. Present the data of Table 8.8 by a suitable histo- gram. TABLE 8.8. AVERAGE MONTHL...
A:
Q: Stoaches are fictional creatures, sometimes mistaken for mome raths. Suppose a two-tailed t-test is ...
A: Given that Sample size n =13 Sample mean =7 Degree of freedom =df = n -1
Q: Listed below are systolic blood pressure measurements (mm Hg) taken from the right and left arms of...
A:
Q: The appropriate set of hypotheses to test the psychologist's claim is μ= 14.72; μ+14.72 Ο μ-14.72; μ...
A: We have given that Mean, μ = 14.72 Standard deviation = 14.98 SE(mean) = 0.57568 Sample size n = 65...
Q: ne following results are for independent Fahdom samples taken Sample 1 Sample 2 - 20 n- 30 x - 22.7 ...
A: Given that Sample size n1=20 , n2=30 s1=2.9 , s2=4.6 Degree of freedom =df = n1+n2-2
Q: Create a frequency table. Also, include a bar chart showing the results. Based on the results, pro...
A: Frequency table: Representation Favorite restaurant Frequency 1 Newks 1 2 Outback 1 3 Sol...
Q: Illustration 8.7. Present the data of Table 8.8 by a suitable histo- gram. TABLE 8.8. AVERAGE MONTHL...
A:
Q: The 19th percentile of the baby weights is pounds. Your answer is incorrect.
A: Given that. X~N( μ , ?^2 ) μ=? , ?=5.3 Z-score =( x - μ )/?
Q: Find the z-scores that separate the middle 42% of the distribution from the area in the tails of the...
A: GivenThe middle 42% of the distribution
Q: Perform at-test (significance level a- 0.0s) to test vour null hypothesis and compare blood syatalie...
A:
Q: 59% of students entering four-year colleges receive a degree within six years. Is this percent small...
A: The random variable students who play intramural sports follows normal distribution. We have to test...
Q: MATLAB
A: The objective is to check the statement cubic equation is determine by cubic spline interpolation is...
Q: For A-D: A certain breed of pigs has weights that are normally distributed with a population mean of...
A: Given,mean(μ)=350standard deviation(σ)=25
Q: Births are approximately Uniformly distributed between the 52 weeks of the year. They can be said to...
A: As per our guidelines we can solve first three sub part of question and rest can be reposted. Soluti...
Estimate the variance of the number of FHH members. Upload a snapshot of your solution.
Estimate the variance of the sample means of the number of FHH members for samples of size 15 taken from the population of FHHs in Brgy Mayaman using your gathered sample data. Upload a snapshot of your solution.
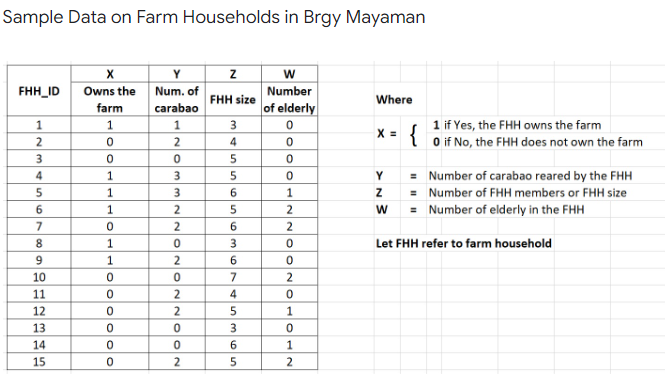
Step by step
Solved in 2 steps
- What is meant by the sample space of an experiment?What is a sample space?A researcher wanted to explore whether fish abundance in tropical coral reef systems differed significantly between the cyclone and non-cyclone seasons. To conduct this experiment, underwater visual census surveys to count the number of fish present were conducted at twenty different coral reef systems during both the cyclone and non-cyclone season of a given year. What type of statistical test should be used to determine if there is a difference in seasonal fish abundance; ANOVA, paired t-test, 1 sample t-test, or a 2 sample t-test?
- Women in the Labor Force. The Organization for Economic Cooperation and Development (OECD) summarizes data on labor-force participation rates in OECD in Figures. Independent simple random samples were taken of 300 U.S.women and 250 Canadian women. Of the U.S. women, 215 were found to be in the labor force; of the Canadian women, 186 were found to be in the labor force. a. At the 5% significance level, do the data suggest that there is a difference between the labor-force participation rates of U.S. and Canadian women?b. Find and interpret a 95% confidence interval for the difference between the labor-force participation rates of U.S. and Canadian women.A high school principal wanted to know if there was a difference in absences for 9th grade, 10th grade, 11th grade, or 12th grade among students with less than a 2.0 GPA. She took a random sample of n = 5 students from each grade and compared absences among the four grades using ANOVA. The data are below: 9th grade 10th grade 11th grade 12th grade 6 9 6 7 7 10 12 11 11 14 17 8 11 14 15 15 16 12 12 12 1)Calculate Mean Square Between Group (MSBG) 2)Calculate Mean Square Within Group (MSWG) 3) Calculate the F statistic Please show work and not excelA high school principal wanted to know if there was a difference in absences for 9th grade, 10th grade, 11th grade, or 12th grade among students with less than a 2.0 GPA. She took a random sample of n = 5 students from each grade and compared absences among the four grades using ANOVA. The data are below: 9th grade 10th grade 11th grade 12th grade 6 9 6 7 7 10 12 11 11 14 17 8 11 14 15 15 16 12 12 12 1)Calculate the Sum of Squares total (SStot) 2) Calculate the Sum of Squares Between Groups (SSBG) 3) Calculate Sum of Squares Within Groups (SSWG) Please show work and not excel-Need help understanding and breaking it down
- A high school principal wanted to know if there was a difference in absences for 9th grade, 10th grade, 11th grade, or 12th grade among students with less than a 2.0 GPA. She took a random sample of n = 5 students from each grade and compared absences among the four grades using ANOVA. The data are below:A process for producing electronic circuits has achieved very high yield levels. An average of only 8 defective parts per million is currently produced. a. What are the upper and lower control limits for a sample size of 100? b. Recompute the upper and lower control limits for a sample size of 10,000. c. Which of these two sample sizes would you recommend? Explain.Chicken farming is a multi-billion dollar industry, and any methods that increase the growth rate of young chicks can reduce consumer costs while increasing company profits, possibly by millions of dollars. An experiment was conducted to measure and compare the effectiveness of various feed supplements on the growth rate of chickens. Newly hatched chicks were randomly allocated into six groups, and each group was given a different feed supplement. Below are some summary statistics from this data set showing the distribution of weights by feed type. Mean SD Sample Size casein 323.58 64.43 12 horsebean 160.20 38.63 10 linseed 218.75 52.24 12 meatmeal 276.91 64.90 11 soybean 246.43 54.13 14 sunflower 328.92 48.84 12 (a) Do these data provide strong evidence that the average weights of chickens that were fed lineseed and horsebean are different? Use a 5% significance level.Hint: We are interested in the difference: lineseed-horsebean Test Statistic: _______…