etermine the range of the P-value for this hypothesis test. Choose the correct answer below. OA. The P-value is between 0.04 and 0.05. O B. The P-value is between 0.3 and 0.4. OC. The P-value is greater than 0.5. O D. The P-value is between 0.001 and 0.002. /hat conclusion can be drawn at a= 0.01 level of significance? OA. Do not reject the null hypothesis because the P-value is less than a = 0.01. O B. Reject the null hypothesis because the P-value is less than a = 0.01. OC. Do not reject the null hypothesis because the P-value is greater than or equal to a= 0.01. O D. Reject the null hypothesis because the P-value is greater than or equal to a = 0.01. ) Assuming the residuals are normally distributed, construct a 95% confidence interval about the slope of the true least-squares regression line. Lower Bound = Upper Bound = Round to three decimal places as needed.) ) For a 42-year-old male patient who visits the doctor's office, would using the least-squares regression line obtained in part (b) to predict the HDL cholesterol of this patient be recommended? hould this least-squares regression line be used to predict the patient's HDL cholesterol? OA. Yes, because the confidence interval about the slope of the true least-square regression line indicates that there is a linear relationship between age and HDL cholesterol levels. O B. No, because the hypothesis test indicates that there is not a linear relationship between age and HDL cholesterol levels. O C. No, because the confidence interval about the slope of the true least-square regression line indicates that there is a linear relationship between age and HDL cholesterol levels. O D. Yes, because the hypothesis test indicates that there is a linear relationship between age and HDL cholesterol levels. good estimate for the HDL cholesterol of this patient isO Round to two decimal places as needed.)
etermine the range of the P-value for this hypothesis test. Choose the correct answer below. OA. The P-value is between 0.04 and 0.05. O B. The P-value is between 0.3 and 0.4. OC. The P-value is greater than 0.5. O D. The P-value is between 0.001 and 0.002. /hat conclusion can be drawn at a= 0.01 level of significance? OA. Do not reject the null hypothesis because the P-value is less than a = 0.01. O B. Reject the null hypothesis because the P-value is less than a = 0.01. OC. Do not reject the null hypothesis because the P-value is greater than or equal to a= 0.01. O D. Reject the null hypothesis because the P-value is greater than or equal to a = 0.01. ) Assuming the residuals are normally distributed, construct a 95% confidence interval about the slope of the true least-squares regression line. Lower Bound = Upper Bound = Round to three decimal places as needed.) ) For a 42-year-old male patient who visits the doctor's office, would using the least-squares regression line obtained in part (b) to predict the HDL cholesterol of this patient be recommended? hould this least-squares regression line be used to predict the patient's HDL cholesterol? OA. Yes, because the confidence interval about the slope of the true least-square regression line indicates that there is a linear relationship between age and HDL cholesterol levels. O B. No, because the hypothesis test indicates that there is not a linear relationship between age and HDL cholesterol levels. O C. No, because the confidence interval about the slope of the true least-square regression line indicates that there is a linear relationship between age and HDL cholesterol levels. O D. Yes, because the hypothesis test indicates that there is a linear relationship between age and HDL cholesterol levels. good estimate for the HDL cholesterol of this patient isO Round to two decimal places as needed.)

Glencoe Algebra 1, Student Edition, 9780079039897, 0079039898, 2018
18th Edition
ISBN:9780079039897
Author:Carter
Publisher:Carter
Chapter10: Statistics
Section10.4: Distributions Of Data
Problem 19PFA

Related questions

Topic Video
Question
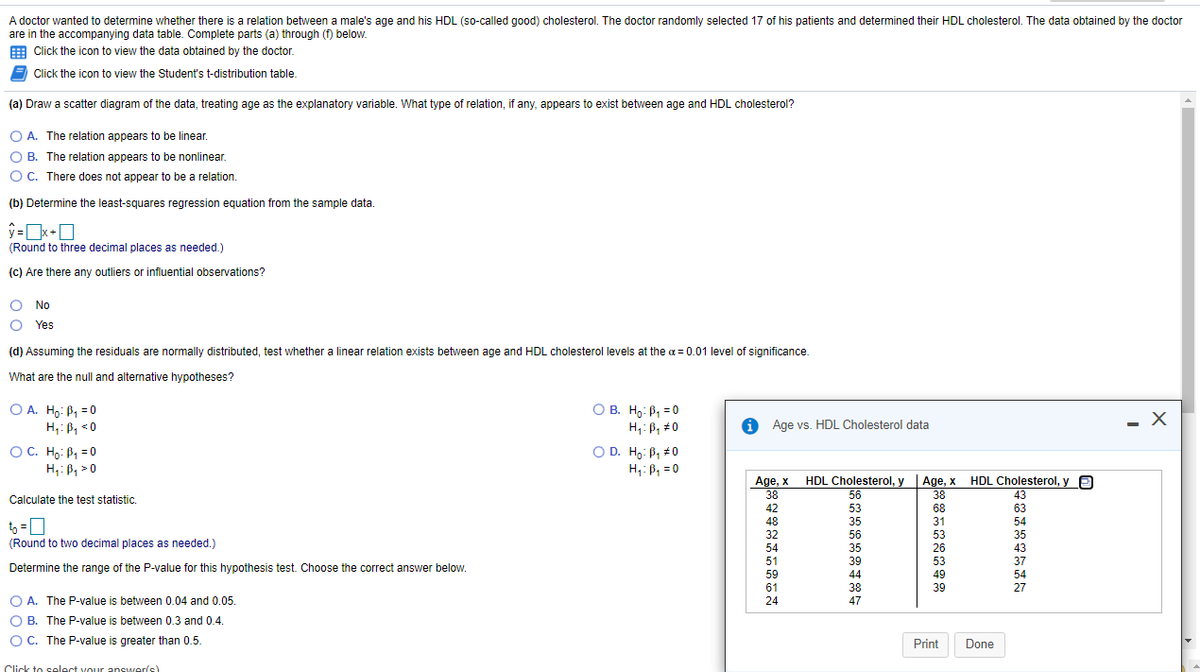
Transcribed Image Text:A doctor wanted to determine whether there is a relation between a male's age and his HDL (so-called good) cholesterol. The doctor randomly selected 17 of his patients and determined their HDL cholesterol. The data obtained by the doctor
are in the accompanying data table. Complete parts (a) through (f) below.
E Click the icon to view the data obtained by the doctor.
E Click the icon to view the Student's t-distribution table.
(a) Draw a scatter diagram of the data, treating age as the explanatory variable. What type of relation, if any, appears to exist between age and HDL cholesterol?
O A. The relation appears to be linear.
O B. The relation appears to be nonlinear.
O C. There does not appear to be a relation.
(b) Determine the least-squares regression equation from the sample data.
(Round to three decimal places as needed.)
(c) Are there any outliers or influential observations?
No
Yes
(d) Assuming the residuals are normally distributed, test whether a linear relation exists between age and HDL cholesterol levels at the a = 0.01 level of significance.
What are the null and alternative hypotheses?
O A. Ho: B1 =0
H;: B, <0
O B. H,: P, = 0
H,: P, #0
O Age vs. HDL Cholesterol data
- X
OC. Ho: P, =0
H,: B, >0
O D. Ho: B, #0
H,: B, = 0
Age, x
38
HDL Cholesterol, y
Age, x HDL Cholesterol, y
38
56
43
Calculate the test statistic.
42
53
68
63
to =0
(Round to two decimal places as needed.)
48
35
31
54
32
56
53
35
54
35
26
43
51
39
53
37
Determine the range of the P-value for this hypothesis test. Choose the correct answer below.
59
44
49
54
61
38
39
27
O A. The P-value is between 0.04 and 0.05.
O B. The P-value is between 0.3 and 0.4.
O C. The P-value is greater than 0.5.
24
47
Print
Done
Click to select vour answer(s)
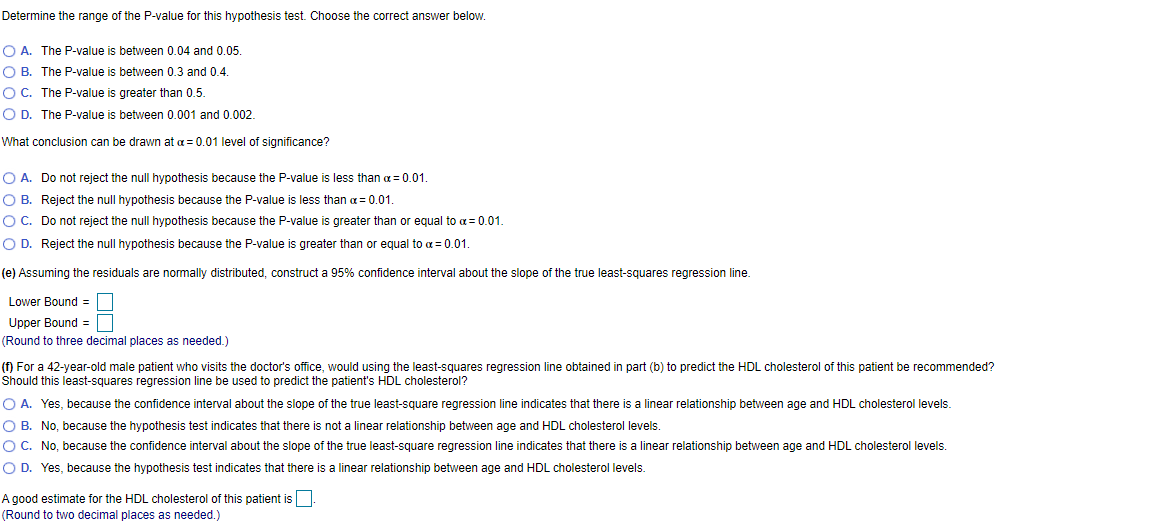
Transcribed Image Text:Determine the range of the P-value for this hypothesis test. Choose the correct answer below.
O A. The P-value is between 0.04 and 0.05.
O B. The P-value is between 0.3 and 0.4.
OC. The P-value is greater than 0.5.
O D. The P-value is between 0.001 and 0.002.
What conclusion can be drawn at a = 0.01 level of significance?
O A. Do not reject the null hypothesis because the P-value is less than a = 0.01.
O B. Reject the null hypothesis because the P-value is less than a= 0.01.
OC. Do not reject the null hypothesis because the P-value is greater than or equal to a= 0.01.
O D. Reject the null hypothesis because the P-value is greater than or equal to a = 0.01.
(e) Assuming the residuals are normally distributed, construct a 95% confidence interval about the slope of the true least-squares regression line.
Lower Bound =
Upper Bound =
(Round to three decimal places as needed.)
(f) For a 42-year-old male patient who visits the doctor's office, would using the least-squares regression line obtained in part (b) to predict the HDL cholesterol of this patient be recommended?
Should this least-squares regression line be used to predict the patient's HDL cholesterol?
O A. Yes, because the confidence interval about the slope of the true least-square regression line indicates that there is a linear relationship between age and HDL cholesterol levels.
O B. No, because the hypothesis test indicates that there is not a linear relationship between age and HDL cholesterol levels.
O C. No, because the confidence interval about the slope of the true least-square regression line indicates that there is a linear relationship between age and HDL cholesterol levels.
O D. Yes, because the hypothesis test indicates that there is a linear relationship between age and HDL cholesterol levels.
A good estimate for the HDL cholesterol of this patient is.
(Round to two decimal places as needed.)
Expert Solution
This question has been solved!
Explore an expertly crafted, step-by-step solution for a thorough understanding of key concepts.

This is a popular solution!

Trending now
This is a popular solution!

Step by step
Solved in 4 steps with 4 images

Knowledge Booster


Learn more about
Need a deep-dive on the concept behind this application? Look no further. Learn more about this topic, statistics and related others by exploring similar questions and additional content below.Recommended textbooks for you
Glencoe Algebra 1, Student Edition, 9780079039897…
Algebra
ISBN:
9780079039897
Author:
Carter
Publisher:
McGraw Hill
Glencoe Algebra 1, Student Edition, 9780079039897…
Algebra
ISBN:
9780079039897
Author:
Carter
Publisher:
McGraw Hill