HW11Q5 PLEASE ALSO FIND THE NUL AND ALTERNATE HYPOTHESIS, TEST STAT, P VALUE, CRITICAL VALUE
HW11Q5 PLEASE ALSO FIND THE NUL AND ALTERNATE HYPOTHESIS, TEST STAT, P VALUE, CRITICAL VALUE

Glencoe Algebra 1, Student Edition, 9780079039897, 0079039898, 2018
18th Edition
ISBN:9780079039897
Author:Carter
Publisher:Carter
Chapter10: Statistics
Section10.4: Distributions Of Data
Problem 19PFA

Related questions
Question
HW11Q5
PLEASE ALSO FIND THE NUL AND ALTERNATE HYPOTHESIS, TEST STAT, P VALUE, CRITICAL VALUE
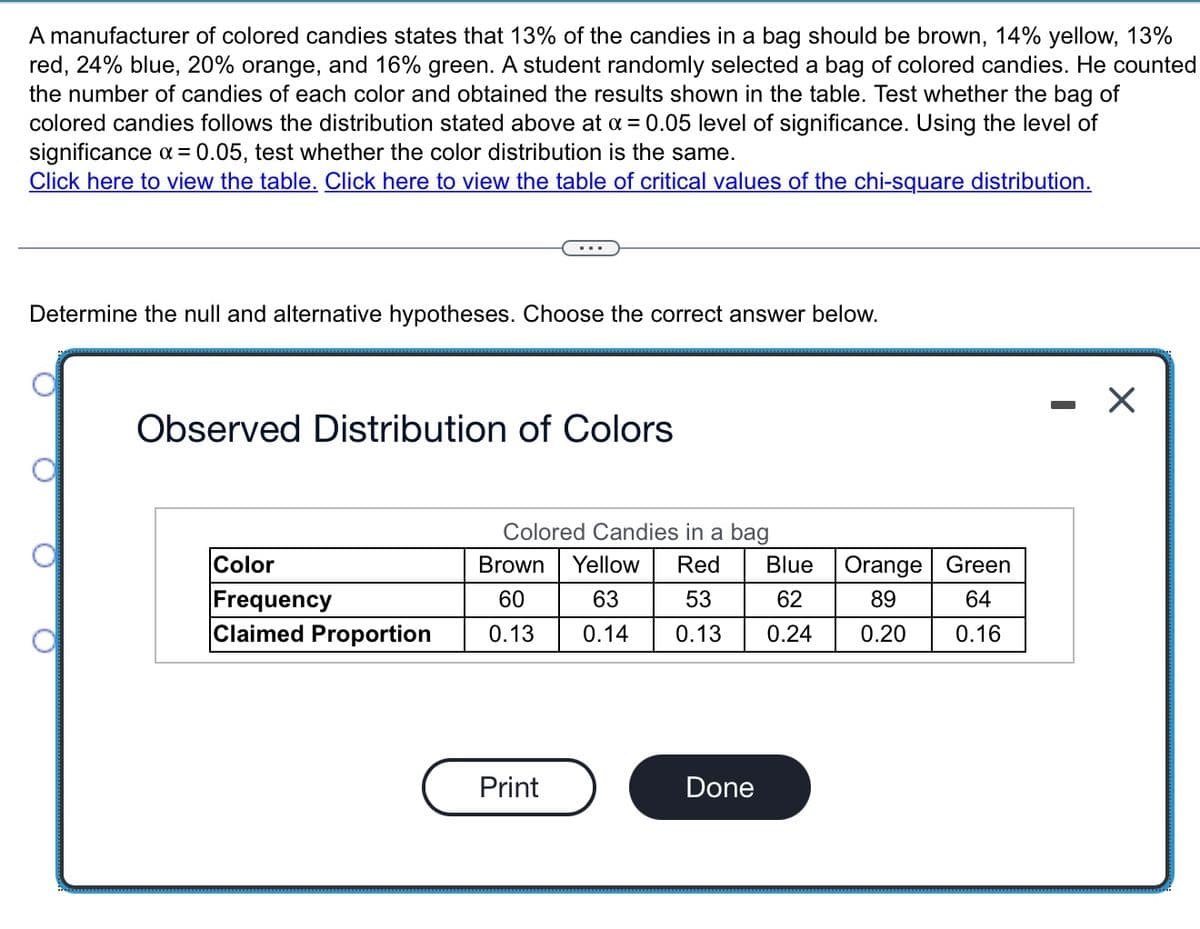
Transcribed Image Text:A manufacturer of colored candies states that 13% of the candies in a bag should be brown, 14% yellow, 13%
red, 24% blue, 20% orange, and 16% green. A student randomly selected a bag of colored candies. He counted
the number of candies of each color and obtained the results shown in the table. Test whether the bag of
colored candies follows the distribution stated above at a = 0.05 level of significance. Using the level of
significance a = 0.05, test whether the color distribution is the same.
Click here to view the table. Click here to view the table of critical values of the chi-square distribution.
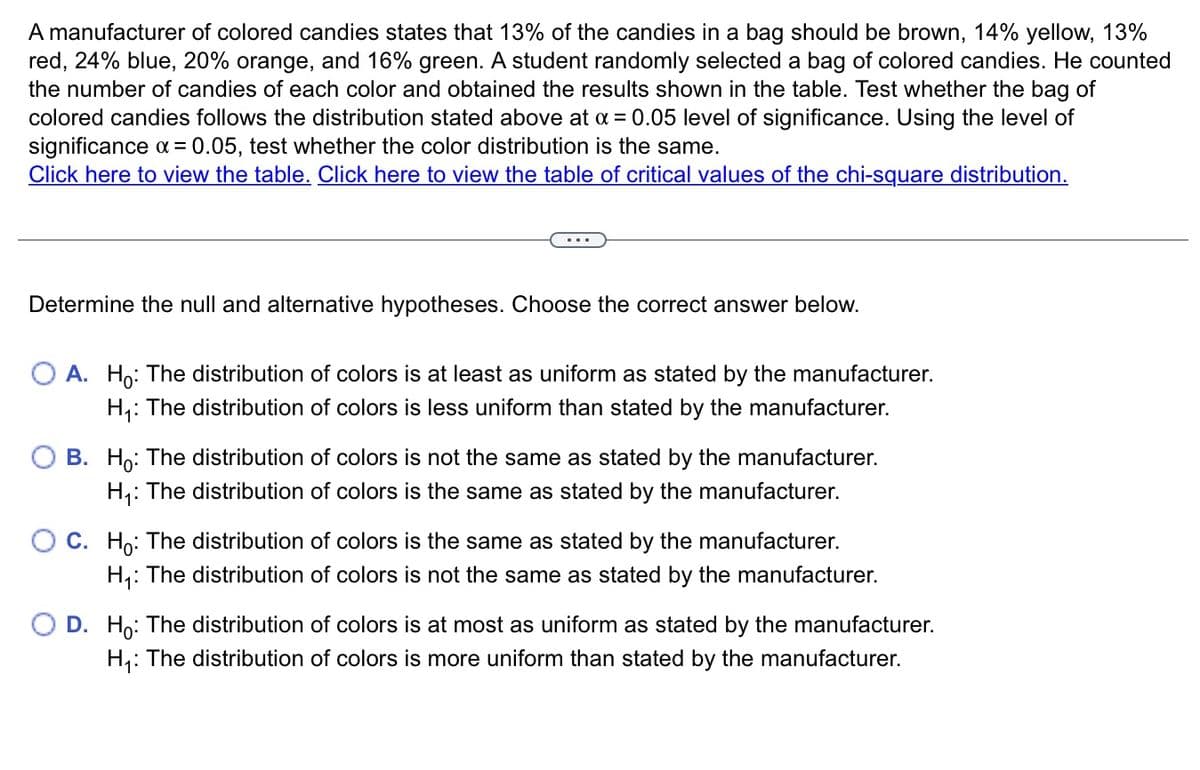
Determine the null and alternative hypotheses. Choose the correct answer below.
Observed Distribution of Colors
Colored Candies in a bag
Color
Brown
Yellow
Red
Blue
Orange Green
Frequency
Claimed Proportion
60
63
53
62
89
64
0.13
0.14
0.13
0.24
0.20
0.16
Print
Done
Transcribed Image Text:A manufacturer of colored candies states that 13% of the candies in a bag should be brown, 14% yellow, 13%
red, 24% blue, 20% orange, and 16% green. A student randomly selected a bag of colored candies. He counted
the number of candies of each color and obtained the results shown in the table. Test whether the bag of
colored candies follows the distribution stated above at a = 0.05 level of significance. Using the level of
significance a = 0.05, test whether the color distribution is the same.
Click here to view the table. Click here to view the table of critical values of the chi-square distribution.
Determine the null and alternative hypotheses. Choose the correct answer below.
O A. Ho: The distribution of colors is at least as uniform as stated by the manufacturer.
H,: The distribution of colors is less uniform than stated by the manufacturer.
B. Ho: The distribution of colors is not the same as stated by the manufacturer.
H,: The distribution of colors is the same as stated by the manufacturer.
O C. Ho: The distribution of colors is the same as stated by the manufacturer.
H,: The distribution of colors is not the same as stated by the manufacturer.
O D. Ho: The distribution of colors is at most as uniform as stated by the manufacturer.
H,: The distribution of colors is more uniform than stated by the manufacturer.
Expert Solution
This question has been solved!
Explore an expertly crafted, step-by-step solution for a thorough understanding of key concepts.

Step by step
Solved in 2 steps

Recommended textbooks for you
Glencoe Algebra 1, Student Edition, 9780079039897…
Algebra
ISBN:
9780079039897
Author:
Carter
Publisher:
McGraw Hill

Holt Mcdougal Larson Pre-algebra: Student Edition…
Algebra
ISBN:
9780547587776
Author:
HOLT MCDOUGAL
Publisher:
HOLT MCDOUGAL

College Algebra (MindTap Course List)
Algebra
ISBN:
9781305652231
Author:
R. David Gustafson, Jeff Hughes
Publisher:
Cengage Learning
Glencoe Algebra 1, Student Edition, 9780079039897…
Algebra
ISBN:
9780079039897
Author:
Carter
Publisher:
McGraw Hill
Holt Mcdougal Larson Pre-algebra: Student Edition…
Algebra
ISBN:
9780547587776
Author:
HOLT MCDOUGAL
Publisher:
HOLT MCDOUGAL
College Algebra (MindTap Course List)
Algebra
ISBN:
9781305652231
Author:
R. David Gustafson, Jeff Hughes
Publisher:
Cengage Learning