Examine the given table below. What conclusions can be drawn from the data regarding the effects of varying pH in bacterial activity? Explain and justify your points Table 1. Effect of different pH on Antibacterial Growth Diameter of Inhibition zone (mm) of different pH 7 6 8 30 21 15 42 34 21 50 41 33 30 22 20 Test organisms 5.8 33 44 54 Staphylococcus 33 aureus Escheichia coli S. typhi Bacillus subtilis 9 12 15 21 0
Examine the given table below. What conclusions can be drawn from the data regarding the effects of varying pH in bacterial activity? Explain and justify your points Table 1. Effect of different pH on Antibacterial Growth Diameter of Inhibition zone (mm) of different pH 7 6 8 30 21 15 42 34 21 50 41 33 30 22 20 Test organisms 5.8 33 44 54 Staphylococcus 33 aureus Escheichia coli S. typhi Bacillus subtilis 9 12 15 21 0

Chapter10: Reconstitution Of Powdered Drugs
Section: Chapter Questions
Problem 8.1P

Related questions

Question
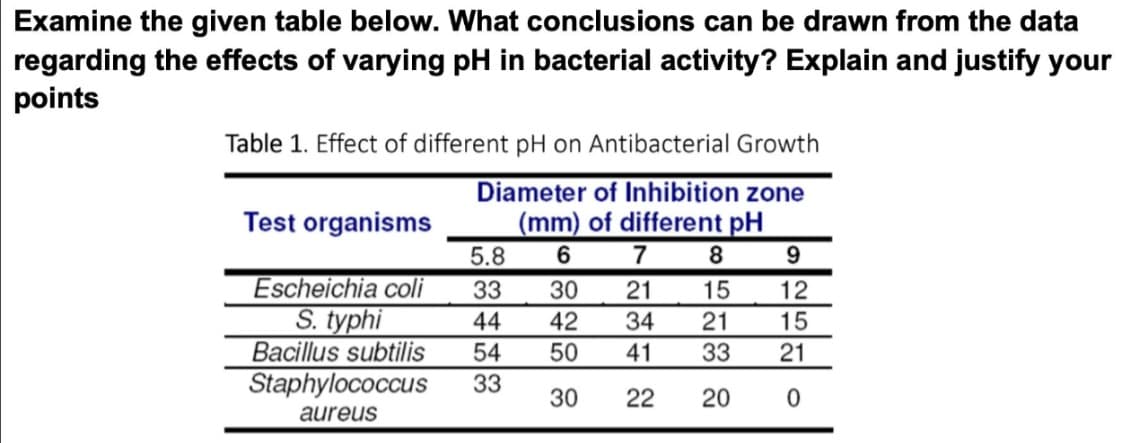
Transcribed Image Text:Examine the given table below. What conclusions can be drawn from the data
regarding the effects of varying pH in bacterial activity? Explain and justify your
points
Table 1. Effect of different pH on Antibacterial Growth
Diameter of Inhibition zone
(mm) of different pH
6
Test organisms
5.8
33
44
54
Staphylococcus 33
aureus
Escheichia coli
S. typhi
Bacillus subtilis
7
8
30
21
15
42 34 21
50 41 33
30
22 20
9
12
15
21
0
Expert Solution
This question has been solved!
Explore an expertly crafted, step-by-step solution for a thorough understanding of key concepts.

Step by step
Solved in 2 steps

Knowledge Booster


Learn more about
Need a deep-dive on the concept behind this application? Look no further. Learn more about this topic, biology and related others by exploring similar questions and additional content below.Recommended textbooks for you