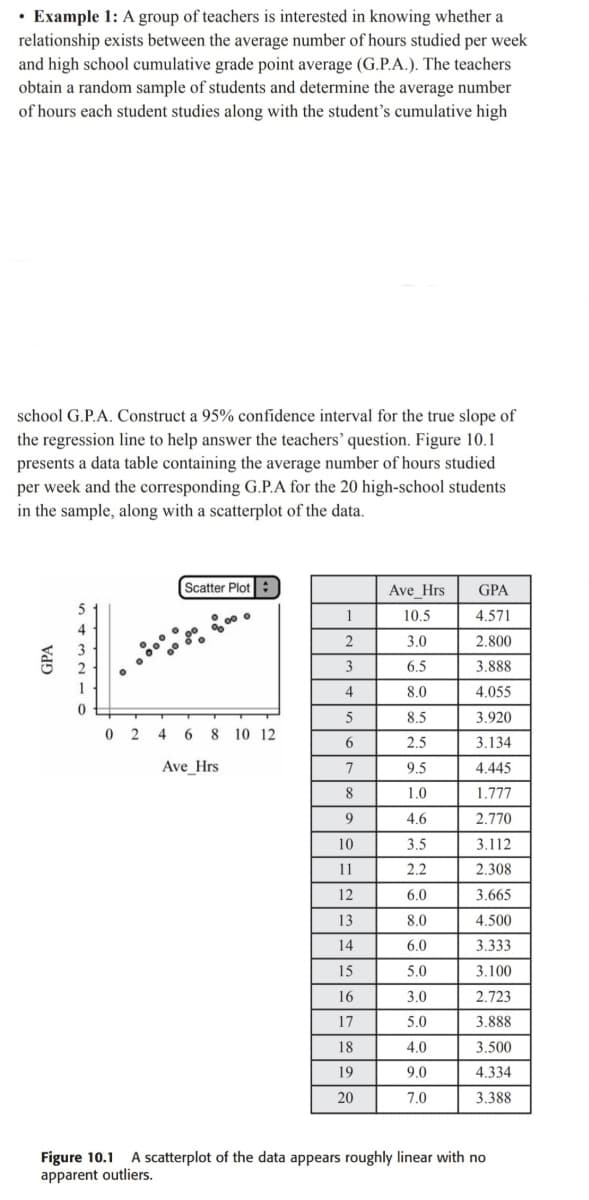
• Example 1: A group of teachers is interested in knowing whether a relationship exists between the average number of hours studied per week and high school cumulative grade point average (G.P.A.). The teachers obtain a random sample of students and determine the average number of hours each student studies along with the student's cumulative high school G.P.A. Construct a 95% confidence interval for the true slope of the regression line to help answer the teachers' question. Figure 10.1 presents a data table containing the average number of hours studied per week and the corresponding G.P.A for the 20 high-school students in the sample, along with a scatterplot of the data. GPA 2 1 0 Scatter Plot 000 0 2 4 6 8 10 12 Ave_Hrs 1 2 3 4 5 6 7 8 9 10 11 12 13 14 15 16 17 18 19 20 Ave Hrs 10.5 3.0 6.5 8.0 8.5 2.5 9.5 1.0 4.6 3.5 2.2 6.0 8.0 6.0 5.0 3.0 5.0 4.0 9.0 7.0 GPA 4.571 2.800 3.888 4.055 3.920 3.134 4.445 1.777 2.770 3.112 2.308 3.665 4.500 3.333 3.100 2.723 3.888 3.500 4.334 3.388 Figure 10.1 A scatterplot of the data appears roughly linear with no apparent outliers.
• Example 1: A group of teachers is interested in knowing whether a relationship exists between the average number of hours studied per week and high school cumulative grade point average (G.P.A.). The teachers obtain a random sample of students and determine the average number of hours each student studies along with the student's cumulative high school G.P.A. Construct a 95% confidence interval for the true slope of the regression line to help answer the teachers' question. Figure 10.1 presents a data table containing the average number of hours studied per week and the corresponding G.P.A for the 20 high-school students in the sample, along with a scatterplot of the data. GPA 2 1 0 Scatter Plot 000 0 2 4 6 8 10 12 Ave_Hrs 1 2 3 4 5 6 7 8 9 10 11 12 13 14 15 16 17 18 19 20 Ave Hrs 10.5 3.0 6.5 8.0 8.5 2.5 9.5 1.0 4.6 3.5 2.2 6.0 8.0 6.0 5.0 3.0 5.0 4.0 9.0 7.0 GPA 4.571 2.800 3.888 4.055 3.920 3.134 4.445 1.777 2.770 3.112 2.308 3.665 4.500 3.333 3.100 2.723 3.888 3.500 4.334 3.388 Figure 10.1 A scatterplot of the data appears roughly linear with no apparent outliers.

College Algebra
7th Edition
ISBN:9781305115545
Author:James Stewart, Lothar Redlin, Saleem Watson
Publisher:James Stewart, Lothar Redlin, Saleem Watson
Chapter1: Equations And Graphs
Section: Chapter Questions
Problem 10T: Olympic Pole Vault The graph in Figure 7 indicates that in recent years the winning Olympic men’s...

Related questions
Question
Transcribed Image Text:• Example 1: A group of teachers is interested in knowing whether a
relationship exists between the average number of hours studied per week
and high school cumulative grade point average (G.P.A.). The teachers
obtain a random sample of students and determine the average number
of hours each student studies along with the student's cumulative high
school G.P.A. Construct a 95% confidence interval for the true slope of
the regression line to help answer the teachers' question. Figure 10.1
presents a data table containing the average number of hours studied
per week and the corresponding G.P.A for the 20 high-school students
in the sample, along with a scatterplot of the data.
GPA
2
1
0
Scatter Plot
000
0 2 4 6 8 10 12
Ave_Hrs
1
2
3
4
5
6
7
8
9
10
11
12
13
14
15
16
17
18
19
20
Ave Hrs
10.5
3.0
6.5
8.0
8.5
2.5
9.5
1.0
4.6
3.5
2.2
6.0
8.0
6.0
5.0
3.0
5.0
4.0
9.0
7.0
GPA
4.571
2.800
3.888
4.055
3.920
3.134
4.445
1.777
2.770
3.112
2.308
3.665
4.500
3.333
3.100
2.723
3.888
3.500
4.334
3.388
Figure 10.1 A scatterplot of the data appears roughly linear with no
apparent outliers.
Expert Solution
This question has been solved!
Explore an expertly crafted, step-by-step solution for a thorough understanding of key concepts.

Step by step
Solved in 5 steps with 5 images

Recommended textbooks for you
College Algebra
Algebra
ISBN:
9781305115545
Author:
James Stewart, Lothar Redlin, Saleem Watson
Publisher:
Cengage Learning

Glencoe Algebra 1, Student Edition, 9780079039897…
Algebra
ISBN:
9780079039897
Author:
Carter
Publisher:
McGraw Hill
College Algebra
Algebra
ISBN:
9781305115545
Author:
James Stewart, Lothar Redlin, Saleem Watson
Publisher:
Cengage Learning
Glencoe Algebra 1, Student Edition, 9780079039897…
Algebra
ISBN:
9780079039897
Author:
Carter
Publisher:
McGraw Hill