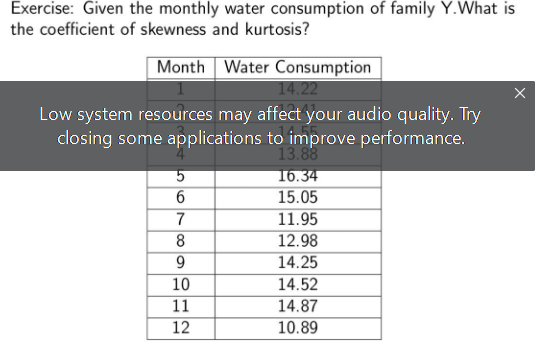
Exercise: Given the monthly water consumption of family Y.What is the coefficient of skewness and kurtosis? Month Water Consumption 14.22 Low system resources may affect your audio quality. Try closing some applications to improve performance. 13.88 5 16.34 6 15.05 7 11.95 8 12.98 9 14.25 10 14.52 11 14.87 12 10.89


Q: Identify which of the two variables are the independent x and dependent y variable for the…
A: We have given the following statement about the two variables.
Q: Problem 8. A common statistical test used in sensory discrimination experiments in food science (as…
A: Given information: p=13k=12n=23p^=1223=0.521739130≈0.5217
Q: Suppose you are a manager for a local clothing store. You want to introduce a new product for an…
A: From the given information, the number of groups (k) is 6.
Q: You are a member of a club on campus. As part of the club's fundraising activities, you sell…
A:
Q: Which of the following calculations are correct calculations of the critical F-value in an one-way…
A: We need to find, which of the given calculations are correct calculations of the critical F-value in…
Q: 4. In what interval does the 3rd decile class belong? a. 1-3 c. 7-9 b. 4-6 d. 10-12 5. How many…
A:
Q: If a procedure meets all of the conditions of a binomial distribution except the number of trials is…
A: Given x=4, p=0.07
Q: Obstetrics The figure below plots the sampling distribution of the mean from 200 samples of size 8…
A:
Q: You are a web designer process engineer for a company that sells Jewelry online. You know that 35.0%…
A: For the given data Perform z test for one proportion
Q: Perform the indicated test of hypotheses, based on the information given. a. Test Ho: μ = 212 vs H₁…
A: Given that
Q: X 24 6 16 64 10 25 35 EX=180 Y 21 3 6 15 21 61 20 EY=147 XY 504 EXY = X² 576 Y² 441 [Y²=
A: Here we have given the data, We have to complete the given table using various values of X and Y.…
Q: 5. Ho: μ = 70 Ha: μ> 70 Critical Value: α = 0.01 n = 65 a = known not
A: Given that Sample size n =65 Population mean =70
Q: Suppose you are an educational researcher, and want to investigate the preferences of students for…
A: We have given that x = 224 n = 297 The sample proportion is p̂ = x/n = 224/297 = 0.7542
Q: You randomly select a card from a 52 card deck. Find the probability of selecting a 3 or 7.
A:
Q: A pet association claims that the mean annual cost of food for dogs and cats are the same. The…
A: Given data is For Dogsx1=244s1=37n1=15For catsx2=209s2=33n2=9α=0.01
Q: The diameter of a brand of tennis balls is approximately normally distributed, with a mean of 2.63…
A: Let X be diameter of a brand of tennis balls. Given, Mean, μ=2.63 Population standard deviation,…
Q: D Desmos | Scientific Calculator X An engineer designed a valve th x + Lesson 11.2a Certify Mode…
A: Given that Sample size n=210 Sample mean =5.2 Population standard deviation =0.6
Q: Observations on the yield of a chemical reaction taken at various temperatures were recorded as…
A: Given: x y 150 75.4 150 81.2 200 85.5 250 89 250 90.5 300 96.7 150 77.7 200 84.4…
Q: High Cholesterol: A group of eight individuals with high cholesterol levels were given a new drug…
A: For the given data Perform paired t test
Q: and model as π = 24.10+ 0.32t. In addition, seasonal indices for January and Februar e calculated as…
A: Given estimate a linear trend model as T = 24.10+ 0.32t. seasonal indices for January and February…
Q: A school administrator claims that the average height of a 9th grade female is 60 inches. The sample…
A: From the provided information, Sample size (n) = 50 Sample mean (x̄) = 58 Standard deviation (σ) = 5…
Q: Suppose that the weights of adult males have a mean of 60kls and standard deviation of 18 kg.…
A: We have given the following n = 15 Mean = 60 Standard deviation= 18
Q: 3. A random variable that can be used to find a 0.954 confidence interval for u, the mean of the…
A:
Q: A manager wishes to determine whether the mean times required to complete a certain task differ for…
A: The choice of the appropriate test statistic depends on the type of research question one is…
Q: If Mc = 51 and ME = 43, for which situation is the 95% confidence interval for the difference…
A:
Q: (Use this information for questions 15-17). A researcher would like to determine if relaxation…
A: There are two dependent samples which are pre training score and post training score. We have to…
Q: Answer Suppose you are analyzing a dataset of 209 datapoints for using in a multiple regression…
A: Given that SSE=218485 And SSR=109225
Q: Imagine you work for a large company that sells a variety of cleaning supplies deigned to prevent…
A: It is given that each group has 181 observations.
Q: 1. Given the data below, compute the following: a. Correlation coefficient i. r= ii. Is the…
A: Hey there! Thank you for posting the question. Since your question has more than 3 parts, we are…
Q: 1. In the Philippine setting, why is an applicant’s response to being asked what she can contribute…
A: Choice of words play an important role in verbal as well as non verbal communication.
Q: You are analyzing a confidence interval using a 90% confidence level in your analysis. You collect a…
A:
Q: Suppose that you are taking a course where the total class grade is the weighted average of your…
A:
Q: Suppose that 1000 customers are surveyed and 850 are satisfied or very satisfied with a…
A:
Q: In baseball, is there a linear correlation between batting average and home run percentage? Let x…
A: Solution-: Let, X=represent the batting average of a professional baseball player Y=represent the…
Q: A simple random sample of 26 filtered 100-mm cigarettes is obtained from a normally distributed…
A:
Q: A study is undertaken about the relationship between price in $ (x) and demand in units (y) for a…
A: Given standard error of the intercept=41.77 Standard error of the slope=15.17
Q: A local garage wants to benchmark themselves against other similar garages in the area. Suppose that…
A:
Q: Find zα/2 when α = .01 1.96 1.645 2.576 1.28
A:
Q: Suppose you an analyzing a large ANOVA test that yielded a SST of 3256.28, along with a MSE of…
A: Given that SST = 3256.28 MSE = 17.74 Number of groups (k) = 10 Number of observations per group =…
Q: A study was performed to test the effectiveness of aspirin in the treatment of strokes. There were…
A: There are two independent samples which are aspiring group and control group. We have to test…
Q: An auto shop wants to examine the proportion of customers that have to return after an appointment.…
A: Given that Sample sizes n1=381 , n2=258 Sample proportion p1^=0.330 , p2^=0.362
Q: Data was collected for 40 randomly selected trees growing in the median strip of a busy freeway. The…
A: From the given histogram minimum possible tree height = ?
Q: Directions: On the first blank, write the critical values based on the given information. Then, on…
A: Hey there! Thank you for posting the question. Since your question has more than 3 parts, we are…
Q: You are analyzing a confidence interval using a 95% confidence level in your analysis. You collect a…
A: Given that Sample size n =209 Sample proportion p^=0.311
Q: Example 20.11 Suppose we are given an index number series as follows: Year 1995 1996 1997 1998 Index…
A:
Q: During one shift, the express lane clerk recorded how many times customers violated the "10 items or…
A: The histogram shows the number of items over the limit each violator placed on the conveyor belt.
Q: A simple random sample of 42 men from a normally distributed population results in a standard…
A:
Q: Suppose that the duration of a particular type of criminal trial is known to be normally distributed…
A: Let X be the number of days from normal distribution with mean (μ) = 21 and standard deviation (σ)…
Q: . Identify the null hypothesis and the alternative hypothesis. Choose the correct answer below. A.…
A: Given that Sample size n =144 Favorable cases x =66 NOTE:- According to bartleby guidelines expert…
Q: You are a manager for a team of employees that uses a computer system as part of the process for…
A:
step by step solving and complete solution on how you came up with that answer

Step by step
Solved in 3 steps with 3 images

- Samples are collected from the River X and pH values are observed. 9 different pH values are listed in table 3. Table 3 Concentrations 3.55 4.01 5.38 3.22 8.05 5.25 4.67 3.67 3.5Draw box plot and find a. Bowley’s coefficient of skewness b. Karl Pearson’s coefficient of skewness c. Third moment Rubric Stages of Process Marks Imagine and Plan 2Composition 2Effort 1Construct a hypothesis addressing which potato piece will have the greatest surface-area-to-volume ratio. Explain. Table 1a Why Are Cells Small Length (l) (cm) Width (w) (cm) Height (h) (cm) Size of Cross Section (h x w) (cm) Distance Traveled by IKI from Potato Edge (cm) Area of White Region (l x w) (cm) 2.50 2.50 2.50 6.25 cm 0.20 cm 2.64 cm 2.00 2.00 1.00 2.00cm 0.30 cm 1.87 cm 1.50 1.50 1.50 2.25 cm 0.50 cm 1.50 cm 1.00 1.00 1.00 1.00 cm 0.40 0.60 cm 2.00 0.50 0.50 0.25 cm 0.20 cm 0.15 cm 0.50 0.50 0.50 0.25 cm 0.30 cm 0.10 cmIn relation to an evaluation of a natural park you have collected data on the visitors, and obtaineddata for the travel costs and their zones of origin, i.e. basic data needed when applying the TravelCost Method.All visitors come by car and there’s only one person in each car. There are four different zones (Iclose, and IV most far away) and the total cost per person is given in the table below. Give a short explanation of the TCM. Would it be possible to do a reasonable TCM analysis from these data? Zone Travel cost per person($) Total population ineach zone Annual number ofvisitors from eachzone I 10 4000 400 II 15 3000 250 III 20 3500 410 IV 25 4000 450
- The article “Effect of Varying Solids Concentration and Organic Loading on the Performance of Temperature Phased Anaerobic Digestion Process” (S. Vandenburgh and T. Ellis, Water Environment Research, 2002:142–148) discusses experiments to determine the effect of the solids concentration on the performance of treatment methods for wastewater sludge. In the first experiment, the concentration of solids (in g/L) was 43.94 ± 1.18. In the second experiment, which was independent of the first, the concentration was 48.66 ± 1.76. Estimate the difference in the concentration between the two experiments, and find the uncertainty in the estimate.The data given is shown below 40 40 43 46 44 49 51 54 46 51 47 49 49 45 45 44 45 41 49 52 51 54 50 51 41 52 53 50 46 56 42 42 40 42 49 47 51 48 46 57 48 55 49 46 57 44 49 43 44 43 51 48 48 46 49 Class width = 6 Find the following: A. Decile (5th) B. Quartile (2nd) C. Skewness D. KurtosisThe betas are chosen so as to minimize: a. Errors b. SSR c. PMP d. Bias e. Noise
- A research company has designed three different systems to clean up oil spillages. The following table contains the results, measured by how much surface area (in square meters) is cleared in 1 hour. The data were found by testing each method in several trials. Is there any significant difference in the testing of effectiveness of the three systems? Use the 0.05 level of significance. System A System B System C 265 267 276 270 263 262 273 274 271 266 259 267 269 272 - 265 - -. Two soft drink dispensing machines should dispense 8 oz of your selection into a cup. The table below shows the data Machine 1 9.52 6.41 10.07 5.85 8.15 Machine 2 8.01 7.99 7.95 8.03 8.02 Which is more consistent in dispensing soda base on the measures of dispersion? Show all solutions.Q1A) List down the measures of central tendency and measures of dispersion 1) Q1B) The operations manager of a plant that manufactures tires wants to compare the actual inner diameters of two grades of tires, each of which is expected to be 575 millimeters. A sample of five tires of each grade was selected, and the results representing the inner diameters of the tires, ranked from smallest to largest, are as follows. Grade X grade Y 568 570 575 578 584 573 574 575 577 578 requirement. a) for each of the tow grades of tries, compute the mwan, median, and standred deviation. b) which grade of tire providing better quality? explain. c) what would be the effect on your answer in (a) and (b) if the last value for grade Y were 588 insert 578 explain. PLEAS ANSWER Q1&B. THANK YOU.
- Amelia is interested in understanding the factors surrounding fringe benefits and salary packages in Australia. She estimates the model: Annbens = β0 + β1 lannearn + β3exper + β4expersq + β5educ + β6male + β7 male_educ + u Using STATA she estimates Model (F1) by OS and obtains the following results: Source SS df MS Model Residual 702938241 427363687 7 602 100419749 709906.456 Total 1.1303e+09 609 1855996.6 annbens coef. std. err. t P > |t| [95% Conf. Interval] lannhrs -1180.478 181.3568 -6.51 0.000 -1536.647 -824.3093 lannearn 2033.2 91.60081 22.20 0.000 1853.304 2213.096 exper 24.83705 11.12976 2.23 0.026 2.97918 46.69493 expersq -0.4499223 0.2366406 -1.90 0.058 -0.9146638 0.0148192 educ -3.846457 21.41313 -0.18 0.858 -45.89996 38.20705 male -21.9345 328.8641 -0.07 0.947 -667.7947 623.9257 male_educ 5.905139 25.45598 0.23 0.817 -44.08817 55.89845 _cons -8190.175 1319.71 -6.21 0.000 -10781.97 -5598.38 Number of obs = 610 F (7, 602) = 141.45…During the graphical analysis of the data below, two different curves were fitted to the data using the least squares method. The curves are as follows. Decide which curve is more suitable by calculating the correlation coefficients.An agronomist undertook an experiment to investigate the factors that potato harvest. In his research, agronomist decided to divide the farm into 30 half hectare plots and apply varies level of fertilizer. Potato was then planted and the harvest at the end of the season was recorded. Fertilizer(Kg) Harvest (tons) 210 43.5 220 40.0 230 48.0 240 65.0 250 80.0 260 85.0 270 95.0 280 80.0 290 97.3 Note: No excel ANOVA output allowed. Students need to show all the steps in calculations. You are required to; Find the simple regression line and interpret the coefficients. Find the coefficient of determination and interpret its value. Does the model appear to be a useful tool in predicting the potato harvest? If so, predict the harvest when 250KG of fertilizer is applied. If not explain why not.