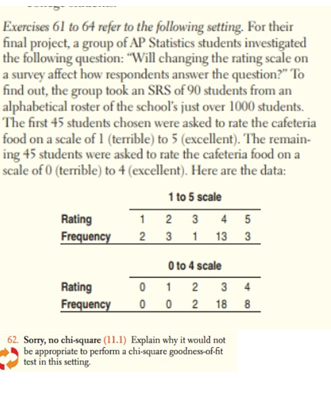
Exercises 61 to 64 refer to the following setting. For their final project, a group of AP Statistics students investigated the following question: "Will changing the rating scale on a survey affect how respondents answer the question?" To find out, the group took an SRS of 90 students from an alphabetical roster of the school's just over 1000 students. The first 45 students chosen were asked to rate the cafeteria food on a scale of 1 (terrible) to 5 (excellent). The remain- ing 45 students were asked to rate the cafeteria food on a scale of 0 (terrible) to 4 (excellent). Here are the data: 1 to 5 scale 1 2 3 4 5 2 3 1 13 3 Rating Frequency O to 4 scale Rating Frequency 0 1 2 3 4 0 0 2 18 8 62. Sorry, no chi-square (11.1) Explain why it would not be appropriate to perform a chi-square goodness-of fit test in this setting
Exercises 61 to 64 refer to the following setting. For their final project, a group of AP Statistics students investigated the following question: "Will changing the rating scale on a survey affect how respondents answer the question?" To find out, the group took an SRS of 90 students from an alphabetical roster of the school's just over 1000 students. The first 45 students chosen were asked to rate the cafeteria food on a scale of 1 (terrible) to 5 (excellent). The remain- ing 45 students were asked to rate the cafeteria food on a scale of 0 (terrible) to 4 (excellent). Here are the data: 1 to 5 scale 1 2 3 4 5 2 3 1 13 3 Rating Frequency O to 4 scale Rating Frequency 0 1 2 3 4 0 0 2 18 8 62. Sorry, no chi-square (11.1) Explain why it would not be appropriate to perform a chi-square goodness-of fit test in this setting

Big Ideas Math A Bridge To Success Algebra 1: Student Edition 2015
1st Edition
ISBN:9781680331141
Author:HOUGHTON MIFFLIN HARCOURT
Publisher:HOUGHTON MIFFLIN HARCOURT
Chapter11: Data Analysis And Displays
Section11.4: Two-ways Tables
Problem 7E

Related questions
Question
Transcribed Image Text:Exercises 61 to 64 refer to the following setting. For their
final project, a group of AP Statistics students investigated
the following question: "Will changing the rating scale on
a survey affect how respondents answer the question?" To
find out, the group took an SRS of 90 students from an
alphabetical roster of the school's just over 1000 students.
The first 45 students chosen were asked to rate the cafeteria
food on a scale of 1 (terrible) to 5 (excellent). The remain-
ing 45 students were asked to rate the cafeteria food on a
scale of 0 (terrible) to 4 (excellent). Here are the data:
1 to 5 scale
1 2 3 4 5
2 3 1 13 3
Rating
Frequency
O to 4 scale
Rating
Frequency
0 1 2 3 4
0 0 2 18 8
62. Sorry, no chi-square (11.1) Explain why it would not
be appropriate to perform a chi-square goodness-of fit
test in this setting
Expert Solution
This question has been solved!
Explore an expertly crafted, step-by-step solution for a thorough understanding of key concepts.

This is a popular solution!

Trending now
This is a popular solution!

Step by step
Solved in 2 steps

Knowledge Booster


Learn more about
Need a deep-dive on the concept behind this application? Look no further. Learn more about this topic, statistics and related others by exploring similar questions and additional content below.Recommended textbooks for you
Big Ideas Math A Bridge To Success Algebra 1: Stu…
Algebra
ISBN:
9781680331141
Author:
HOUGHTON MIFFLIN HARCOURT
Publisher:
Houghton Mifflin Harcourt

Mathematics For Machine Technology
Advanced Math
ISBN:
9781337798310
Author:
Peterson, John.
Publisher:
Cengage Learning,

Glencoe Algebra 1, Student Edition, 9780079039897…
Algebra
ISBN:
9780079039897
Author:
Carter
Publisher:
McGraw Hill
Big Ideas Math A Bridge To Success Algebra 1: Stu…
Algebra
ISBN:
9781680331141
Author:
HOUGHTON MIFFLIN HARCOURT
Publisher:
Houghton Mifflin Harcourt
Mathematics For Machine Technology
Advanced Math
ISBN:
9781337798310
Author:
Peterson, John.
Publisher:
Cengage Learning,
Glencoe Algebra 1, Student Edition, 9780079039897…
Algebra
ISBN:
9780079039897
Author:
Carter
Publisher:
McGraw Hill

Elementary Geometry For College Students, 7e
Geometry
ISBN:
9781337614085
Author:
Alexander, Daniel C.; Koeberlein, Geralyn M.
Publisher:
Cengage,