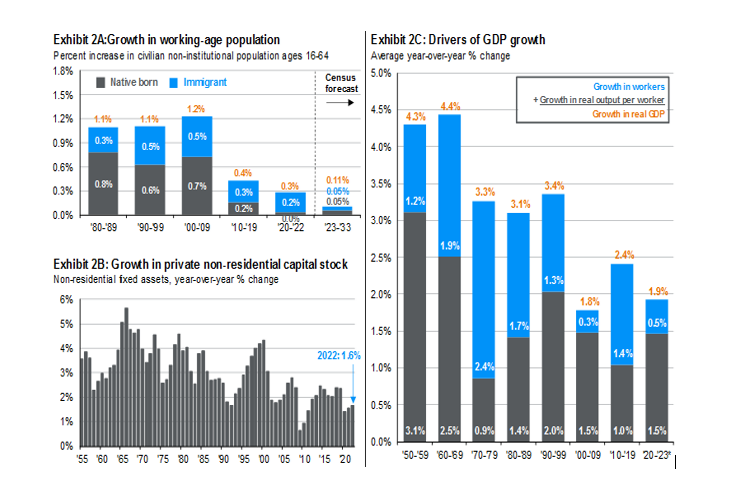
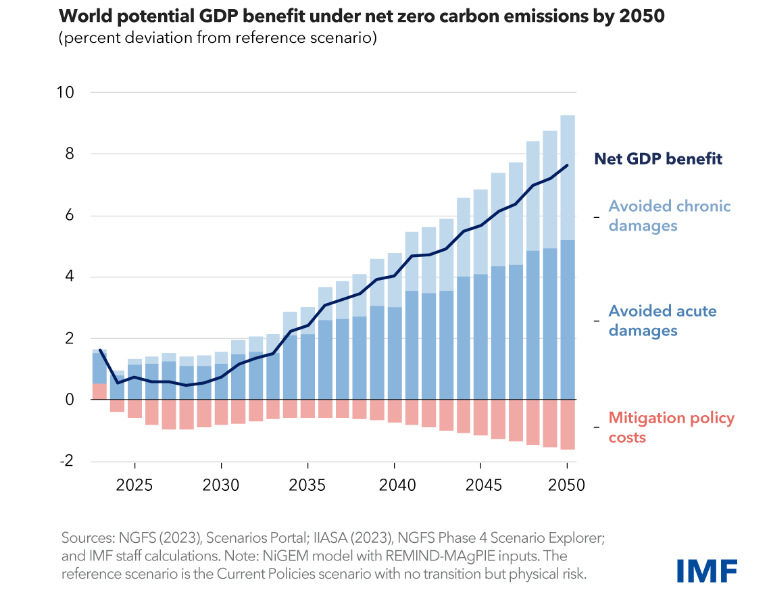
Exhibit 2A:Growth in working-age population Percent increase in civilian non-institutional population ages 16-64 Exhibit 2C: Drivers of GDP growth Average year-over-year % change 1.8% Native born Immigrant 1.5% 1.2% 1.2% 1.1% 1.1% 0.5% 0.9% 0.3% 0.5% Census forecast 5.0% 4.4% 4.5% 4.3% 4.0% Growth in workers + Growth in real output per worker Growth in real GDP 0.6% 0.4% 0.11% 0.8% 0.7% 0.3% 3.5% 3.4% 0.3% 0.6% 0.3% 0.05% 3.3% 0.2% 0.05% 1.2% 3.1% 0.2% 0.0% 0.0% 3.0% '80-'89 '90-99 '00-09 10-19 '20-22 23-33 1.9% 2.5% 2.4% Exhibit 2B: Growth in private non-residential capital stock Non-residential fixed assets, year-over-year % change 2.0% 6% 5% 4% 1.5% 2022: 1.6% 1.0% 2.4% 1.3% 1.9% 1.8% 0.3% 1.7% 0.5% 14% 3% 2% 0.5% 1% 3.1% 2.5% 0.9% 1.4% 2.0% 1.5% 1.0% 1.5% 0.0% 0% 50-59 60-69 70-79 80-89 90-99 100-09 10-19 20-23° 55 60 65 70 75 80 85 90 95 00 05 10 15 20 World potential GDP benefit under net zero carbon emissions by 2050 (percent deviation from reference scenario) 10 8 6 4 2 0 -2 2025 2030 2035 2040 2045 2050 Net GDP benefit Avoided chronic damages Sources: NGFS (2023), Scenarios Portal; IIASA (2023), NGFS Phase 4 Scenario Explorer; and IMF staff calculations. Note: NIGEM model with REMIND-MAGPIE inputs. The reference scenario is the Current Policies scenario with no transition but physical risk. Avoided acute damages Mitigation policy costs IMF


- Based on the charts consulted, comment what is expected from the American economy in the next years in general terms.
- Are there differences in the
forecasts ? - How do you think the state will act in the future based on the chart variables that inform us about its behavior?
- What will the behavior of families and companies be like?
Using these graphs provided, Answer the questions in an essay format, comparing the two.
Source: J.P. Morgan Asset Management; (Top left) Census Bureau, DOD, DOJ; (Top left and right) BLS; (Right and bottom left) BEA.

Step by step
Solved in 2 steps


