Exhibit 9-5 n = 16 HỌ: µ z 80 x = 75.607 Hạ: u < 80 o = 8.246 Assume the population is normally distributed. 3. Refer to Exhibit 9-5. The test statistic equals O.53 O-2.131 O-.53 2.131
Exhibit 9-5 n = 16 HỌ: µ z 80 x = 75.607 Hạ: u < 80 o = 8.246 Assume the population is normally distributed. 3. Refer to Exhibit 9-5. The test statistic equals O.53 O-2.131 O-.53 2.131

Glencoe Algebra 1, Student Edition, 9780079039897, 0079039898, 2018
18th Edition
ISBN:9780079039897
Author:Carter
Publisher:Carter
Chapter10: Statistics
Section: Chapter Questions
Problem 2SGR

Related questions
Question
100%
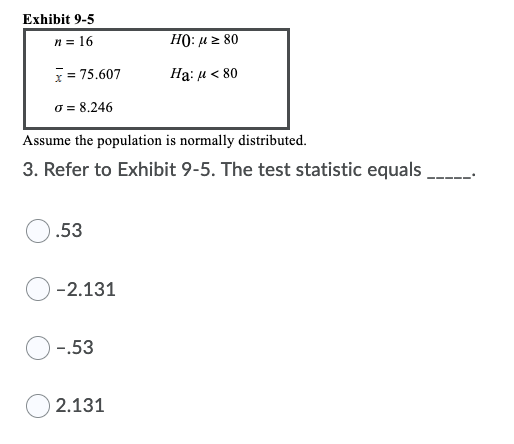
Transcribed Image Text:Exhibit 9-5
n = 16
HO: u z 80
x = 75.607
Hạ: u < 80
o = 8.246
Assume the population is normally distributed.
3. Refer to Exhibit 9-5. The test statistic equals
.53
-2.131
-.53
2.131
Expert Solution
This question has been solved!
Explore an expertly crafted, step-by-step solution for a thorough understanding of key concepts.

This is a popular solution!

Trending now
This is a popular solution!

Step by step
Solved in 2 steps

Recommended textbooks for you
Glencoe Algebra 1, Student Edition, 9780079039897…
Algebra
ISBN:
9780079039897
Author:
Carter
Publisher:
McGraw Hill

Holt Mcdougal Larson Pre-algebra: Student Edition…
Algebra
ISBN:
9780547587776
Author:
HOLT MCDOUGAL
Publisher:
HOLT MCDOUGAL
Glencoe Algebra 1, Student Edition, 9780079039897…
Algebra
ISBN:
9780079039897
Author:
Carter
Publisher:
McGraw Hill
Holt Mcdougal Larson Pre-algebra: Student Edition…
Algebra
ISBN:
9780547587776
Author:
HOLT MCDOUGAL
Publisher:
HOLT MCDOUGAL