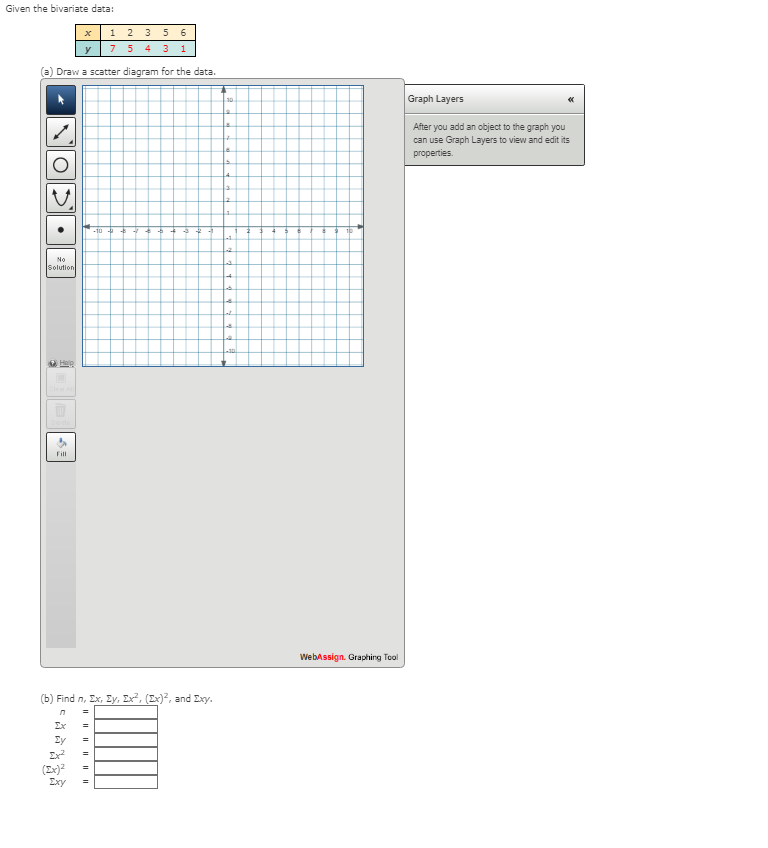
Given the bivariate data: 1 2 3 5 6. y 75 4 3 1 (a) Draw a scatter diagram for the data. Graph Layers 10 After you add an object to the graph you can use Graph Layers to view and edit its properties. 10 No Solution Hap Fill WebAssign. Graphing Tool (b) Find n, Ex, Ey, Ex², (Ex)², and Exy. Ex Ey Ix (Ix)² Exy

College Algebra
10th Edition
ISBN:9781337282291
Author:Ron Larson
Publisher:Ron Larson
Chapter3: Polynomial Functions
Section3.5: Mathematical Modeling And Variation
Problem 2ECP
icon
Related questions
icon
Concept explainers
Question
Given the bivariate data:
1 2 3 5 6
7 5 4 3 1
y
Draw a scatter diagram for the data.
10
Graph Layers
After you add an object to the graph you
can use Graph Layers to view and edit its
properties.
No
Solution
-8
O Hep
Fill
WebAssign. Graphing Tool
(b) Find n, Ex, Ey, Ex2, (Ex)², and Exy.
%3D
Ex
Iy
%3D
%3D
(Ex)2
Exy
%3D
%3D
Il || Il
Transcribed Image Text:Given the bivariate data: 1 2 3 5 6 7 5 4 3 1 y Draw a scatter diagram for the data. 10 Graph Layers After you add an object to the graph you can use Graph Layers to view and edit its properties. No Solution -8 O Hep Fill WebAssign. Graphing Tool (b) Find n, Ex, Ey, Ex2, (Ex)², and Exy. %3D Ex Iy %3D %3D (Ex)2 Exy %3D %3D Il || Il
(c) Find a, the slope of the least-squares line, and b, the y-intercept of the least-squares line. (Round your answers to two decimal places.)
a =
b =
(d) Draw the least-squares line on the scatter diagram from part (a).
10
J0
-10
10
-10
10
-10
-10
10
10
-10
10
-10
10
10
-10
(e) Is the point (x, y) on the least-squares line?
O Yes
O No
(F) Use the equation of the least-squares line to predict the value of y when x = 3.1. (Round your answer to two decimal places.)
y =
(9) Find, to the nearest hundredth, the linear correlation coefficient.
Transcribed Image Text:(c) Find a, the slope of the least-squares line, and b, the y-intercept of the least-squares line. (Round your answers to two decimal places.) a = b = (d) Draw the least-squares line on the scatter diagram from part (a). 10 J0 -10 10 -10 10 -10 -10 10 10 -10 10 -10 10 10 -10 (e) Is the point (x, y) on the least-squares line? O Yes O No (F) Use the equation of the least-squares line to predict the value of y when x = 3.1. (Round your answer to two decimal places.) y = (9) Find, to the nearest hundredth, the linear correlation coefficient.
Expert Solution
steps

Step by step

Solved in 2 steps with 1 images

Blurred answer
Knowledge Booster
Correlation, Regression, and Association
Learn more about
Need a deep-dive on the concept behind this application? Look no further. Learn more about this topic, statistics and related others by exploring similar questions and additional content below.
Recommended textbooks for you
College Algebra
College Algebra
Algebra
ISBN:
9781337282291
Author:
Ron Larson
Publisher:
Cengage Learning
Algebra & Trigonometry with Analytic Geometry
Algebra
ISBN:
9781133382119
Author:
Swokowski
Publisher:
Cengage
Glencoe Algebra 1, Student Edition, 9780079039897…
Algebra
ISBN:
9780079039897
Author:
Carter
Publisher:
McGraw Hill
Functions and Change: A Modeling Approach to Coll…
Algebra
ISBN:
9781337111348
Author:
Bruce Crauder, Benny Evans, Alan Noell
Publisher:
Cengage Learning