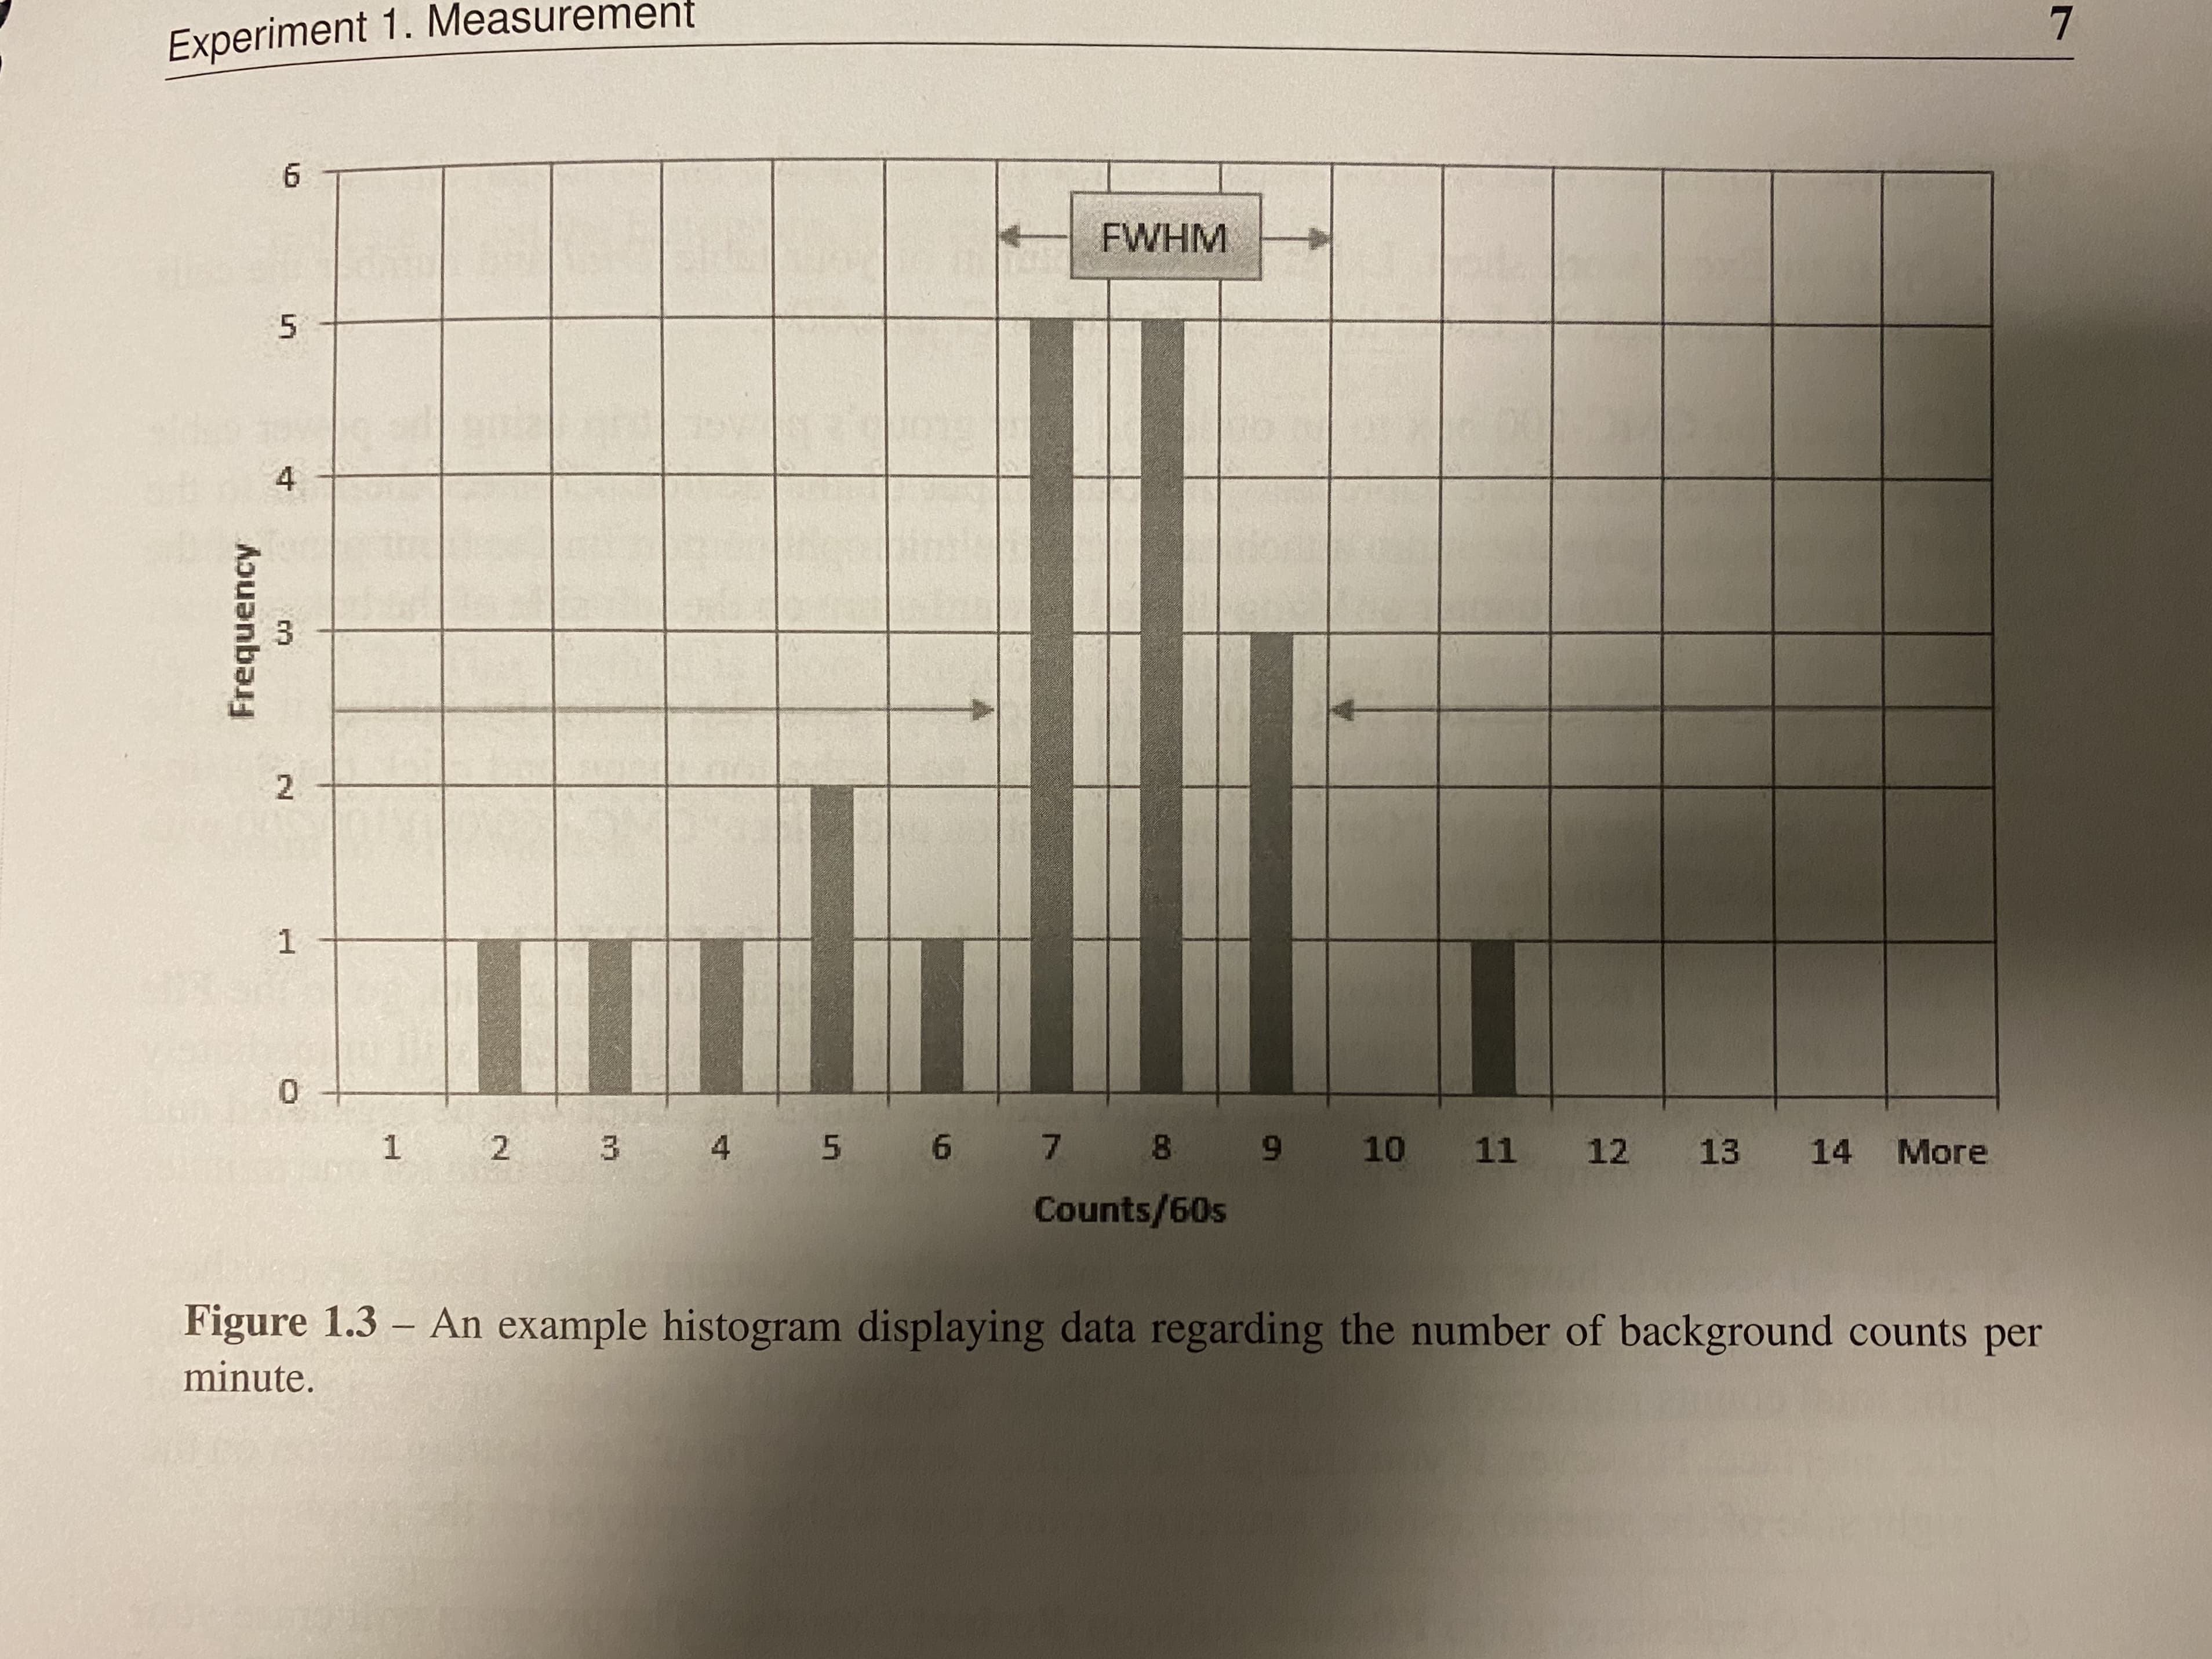
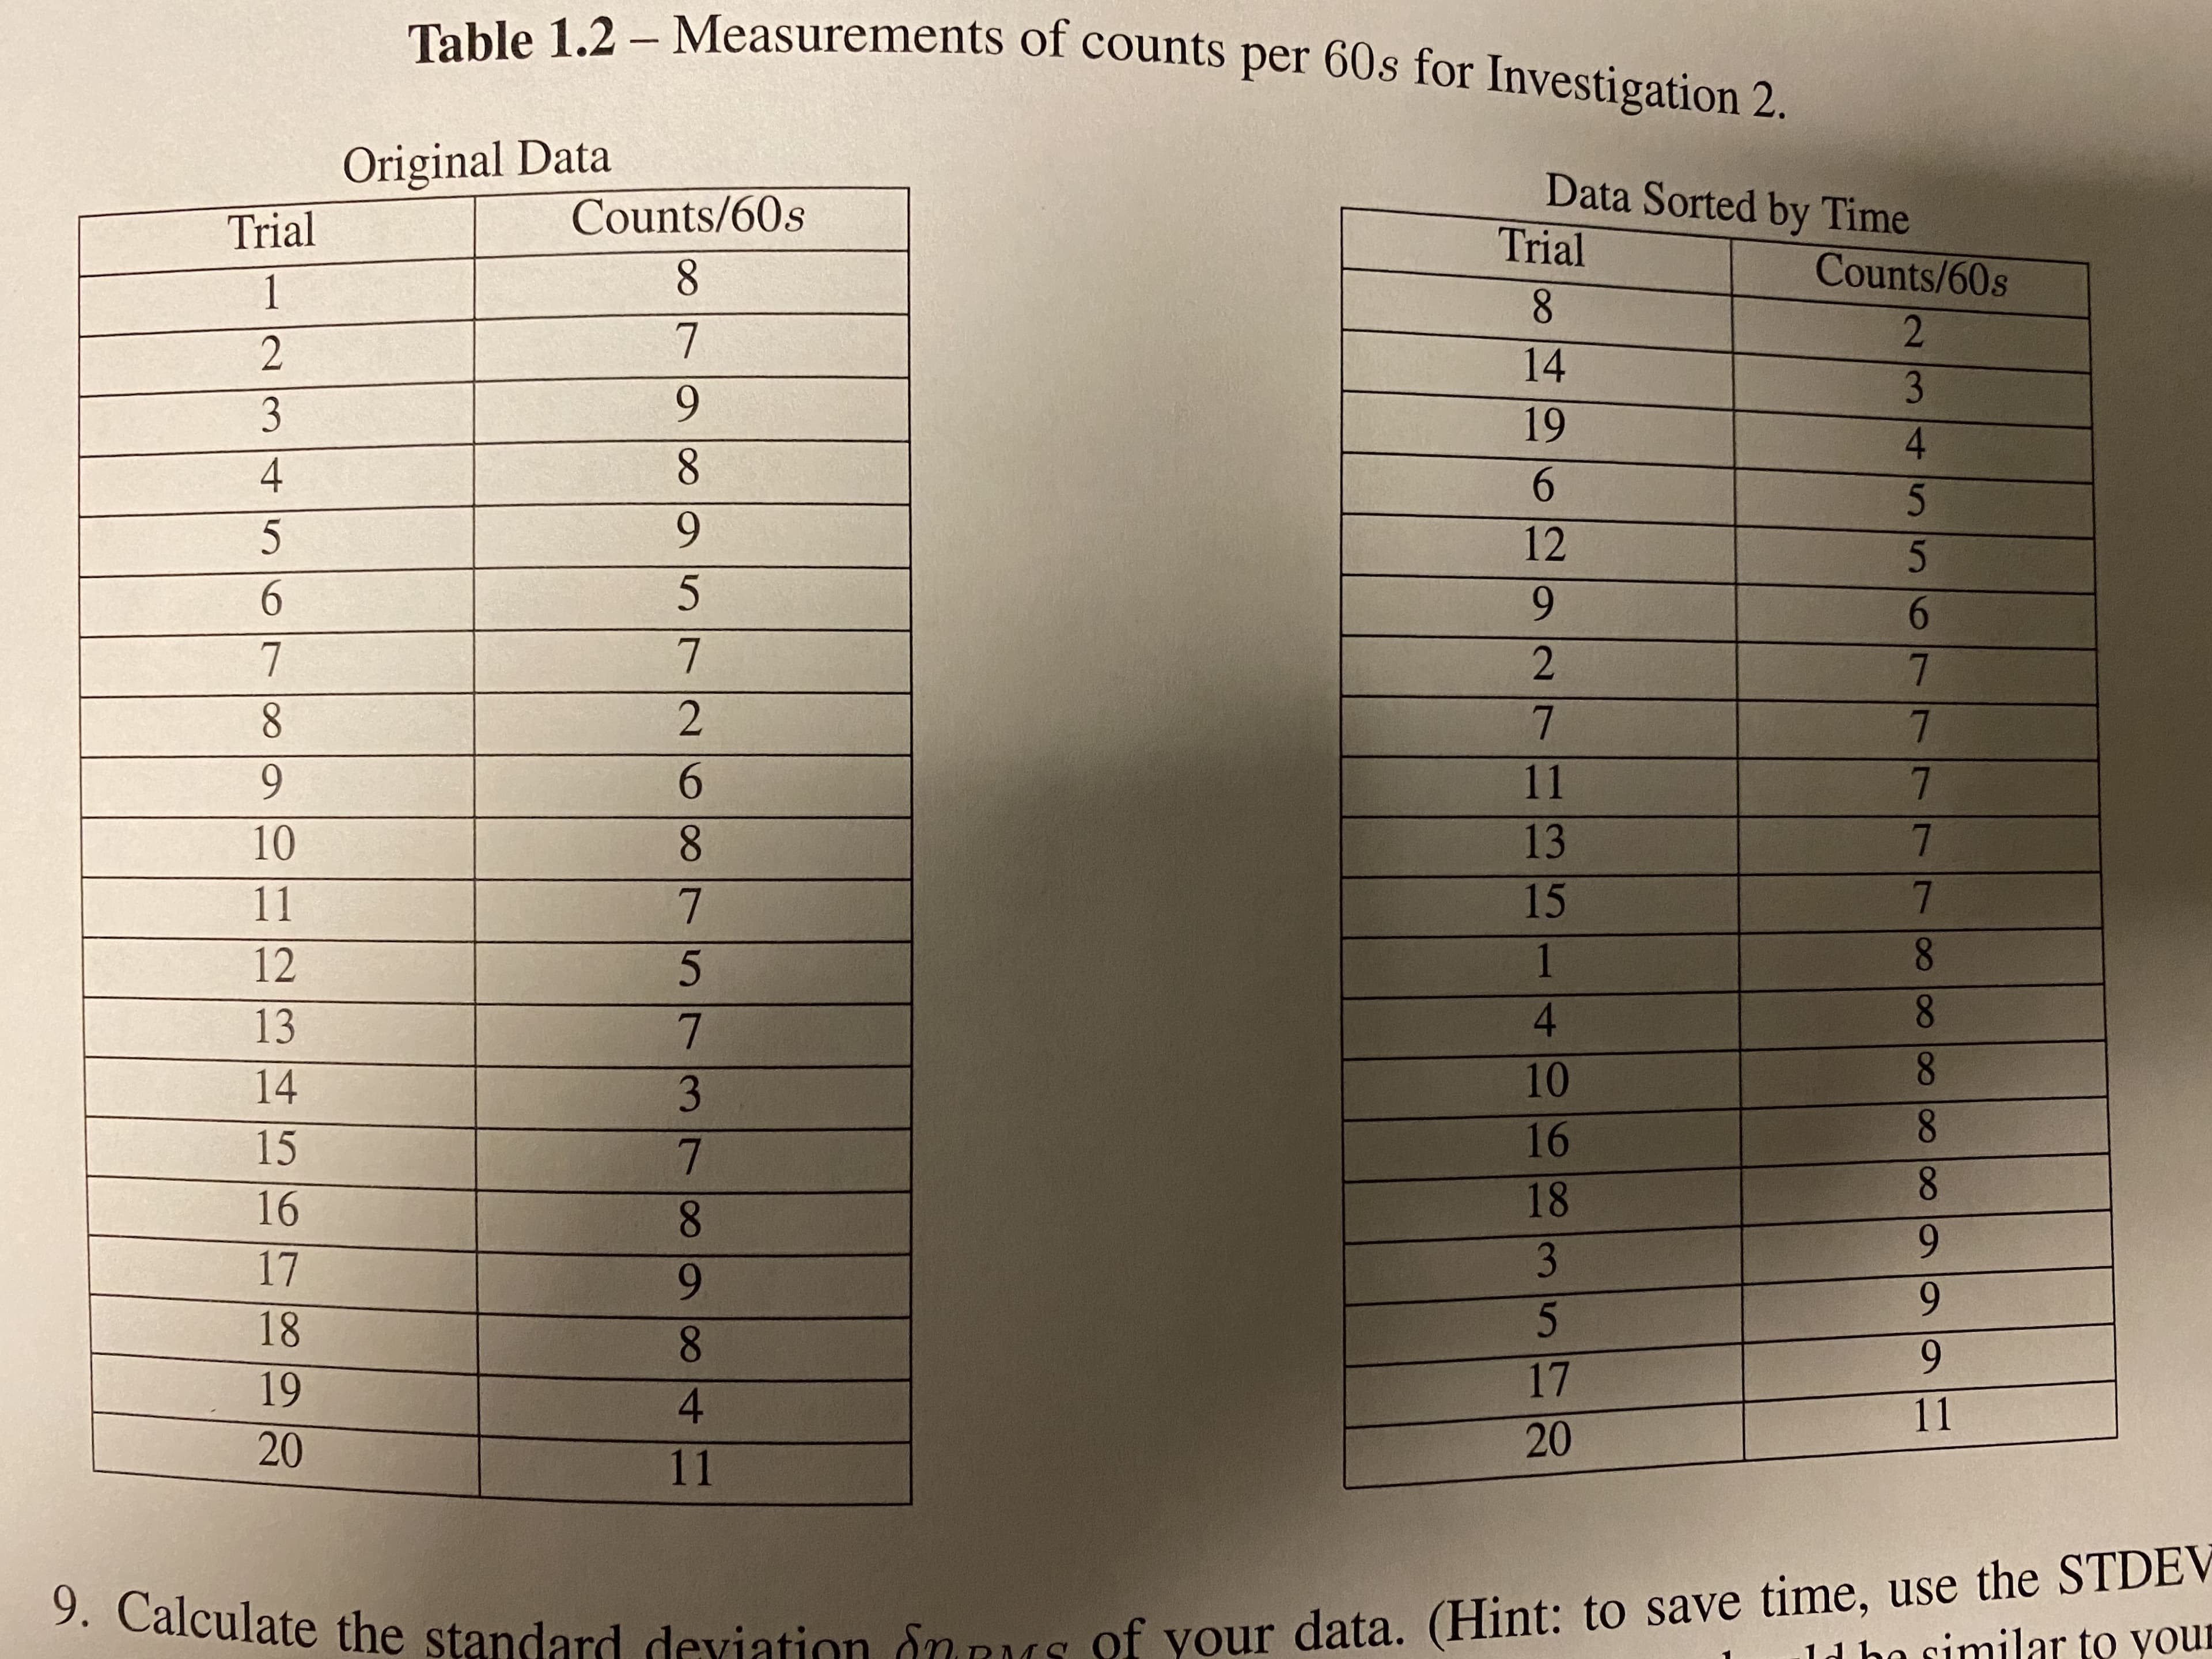
Experiment 1. Measurement 6. FWHM 5. 4 3 9 10 11 12 13 14 More 5 6 7 8 4 9 Counts/60s Figure 1.3 – An example histogram displaying data regarding the number of background counts per minute. Frequency 2. Table 1.2 - Measurements of counts per 60s for Investigation 2. Original Data Data Sorted by Time Counts/60s Trial Trial Counts/60s 8 1 8. 7 14 9. 3 19 4. 4 6. 9. 12 6. 6. 5. 8. 7. 6. 9. 11 7. 7. 13 8. 10 15 11 8. 1 12 80 4. 13 8. 10 14 3 8. 16 15 7. 8. 18 16 8. 6. 3 17 9. 9. 18 8. 6. 17 19 4. 11 20 20 11 9. Calculate the standard deviation Snus of your data. (Hint: to save time, use the STDEV imilar to yoUE ld bo s 75


Inverse Normal Distribution
The method used for finding the corresponding z-critical value in a normal distribution using the known probability is said to be an inverse normal distribution. The inverse normal distribution is a continuous probability distribution with a family of two parameters.
Mean, Median, Mode
It is a descriptive summary of a data set. It can be defined by using some of the measures. The central tendencies do not provide information regarding individual data from the dataset. However, they give a summary of the data set. The central tendency or measure of central tendency is a central or typical value for a probability distribution.
Z-Scores
A z-score is a unit of measurement used in statistics to describe the position of a raw score in terms of its distance from the mean, measured with reference to standard deviation from the mean. Z-scores are useful in statistics because they allow comparison between two scores that belong to different normal distributions.
You are given data from a Geiger counter and asked to create a histogram of the data. Example data and histogram setup is provided in pictures.
If the data from two Geiger counters are combined, how will the standard deviation of the new data set compare to that of each of the individual Geiger counters?


Trending now
This is a popular solution!

Step by step
Solved in 2 steps with 1 images


